
 交易书籍,敬请期待
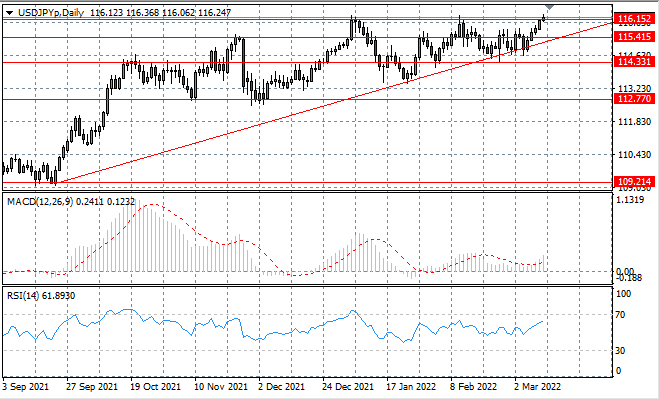
USD/JPY
USDJPY price action has still failed to break the 116.15 resistance line, as bullish momentum has stalled at this recent price ceiling. Longer-term sentiment is bullish with the trendline acting as support. Momentum indicators have upward trajectories with RSI approaching overbought conditions.
USDJPY的价格走势仍然未能突破 116.15 阻力线,因为看涨势头在最近的价格上限处停滞不前。 在趋势线作为支撑的情况下,长期情绪看涨。动量指标具有上升轨迹,相对强弱指数(RSI)接近超买状态。
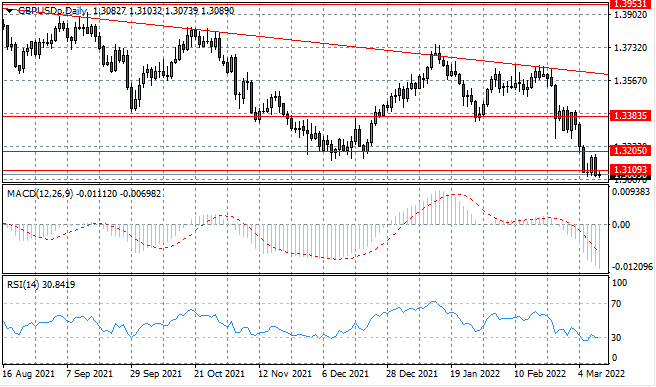
GBP/USD
The GBPUSD pair has dropped towards the 1.310 support level and a break appears to be underway. A previous break attempt was short-lived and followed by a rise in buying activity making this price line a key support area for the pair. Momentum indicators have flattened in bearish territory.
GBPUSD已跌至 1.310 支撑位,似乎正在突破。 之前的突破尝试是短暂的,随后购买活动增加,使该价格线成为该货币对的关键支撑区域。动量指标在看跌区域趋于平缓。
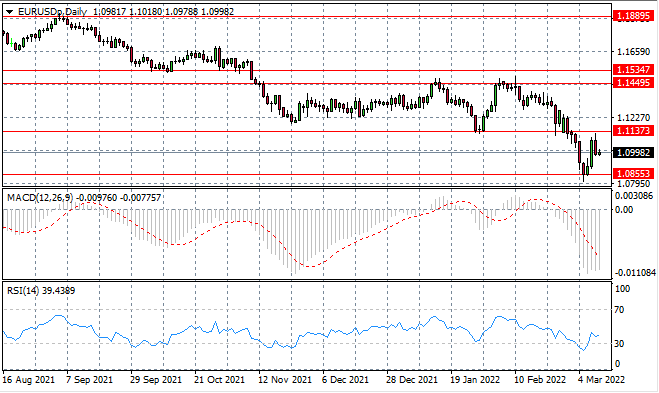
EURUSD
The EURUSD has failed before reaching the 1.113 price level, as selling activity has kept the pair within the 1.085- 1.113 trading range. which represents a key support level of a previous trading range. The strong bullish move has been met with resistance in the early Asian trading session, however, indicating the rally attempt may not last.
EURUSD在达到 1.113 价格水平之前已经失败,因为抛售活动使该货币对保持在 1.085-1.113 的交易区间内。 这代表着先前交易区间的关键支撑位。 然而,强劲的看涨走势在亚洲交易时段早盘遇到阻碍,表明反弹尝试可能不会持续。
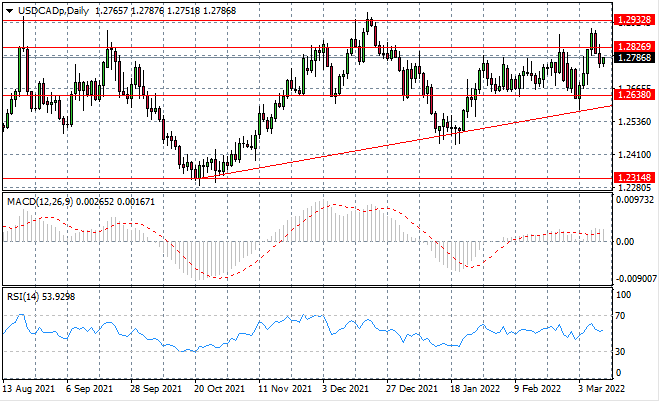
USDCAD
The USDCAD has fallen back to the previous consolidation channel as the bullish break failed to sustain. Selling activity has dominated the pair in the last few trading sessions and price action is likely to be contained within the channel. Momentum indicators have flattened in neutral/bullish territory.
由于看涨突破未能维持,USDCAD已回落至先前的盘整通道。 在过去的几个交易日中,卖盘活动主导了该货币对,价格走势可能包含在通道内。 动能指标在中性/看涨区域趋于平缓。
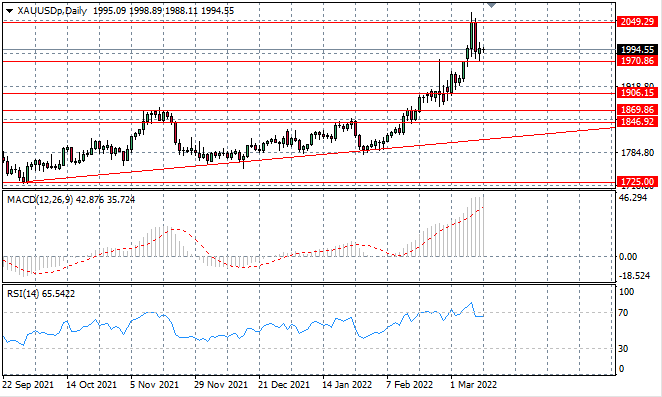
XAUUSD
The XAUUSD volatility has mellowed towards the end of the trading week. Small-bodied candles indicate a slowdown in the selloff as bears take stock. Price action is likely to be contained by the 1970 support level until further developments in fundamentals.
XAUUSD 波动性在交易周结束时有所缓和。 随着空头盘点,小型蜡烛表明抛售放缓。 在基本面进一步发展之前,价格走势可能会被 1970 的支撑位所控制。
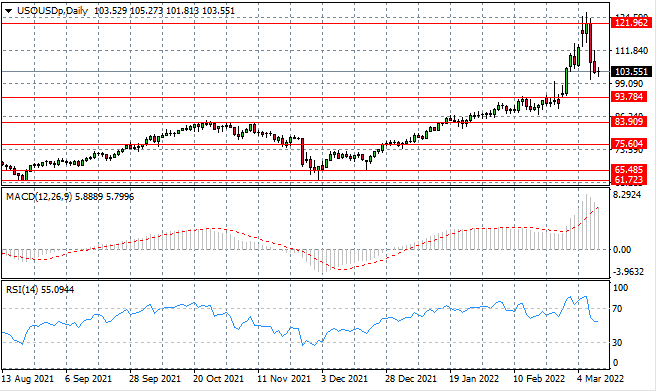
USOUSD
The USOUSD has stalled at the 103 per barrel level with a support level at the 93.78 price line. Selling activity had begun to wane yet was kickstarted again in yesterday's trading. Momentum indicators signal that a reversal is underway although the flattening trajectories confirm sellers are losing steam.
USOUSD 停滞在每桶 103 美元,支撑位在 93.78 价格线。抛售活动已经开始减弱,但在昨天的交易中又重新开始了。动量指标表明正在发生逆转,尽管趋于平缓的轨迹证实卖家正在失去动力。
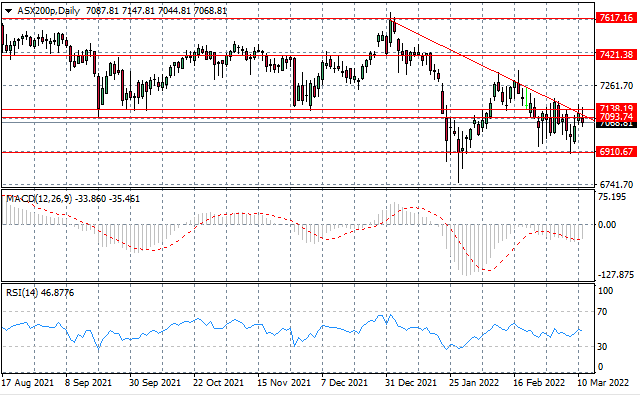
ASX200
The ASX200 is testing the descending trendline which has effectively contained rallies since December 2021. Selling pressure in the last two sessions indicate that another bearish move is on the cards. Momentum indicators are bearish with upward trajectories.
ASX200 正在测试从 2021 年 12 月以来有效限制反弹的下降趋势线。过去两个交易日的抛售压力表明着另一个看跌走势即将到来。动量指标看跌,上行轨迹。
In the event of any discrepancies between the Chinese version and English version of the Daily Insights, the latter shall prevail.
以上文章中英文版本若有任何歧义,概以英文版本为准。
This article is to be used only as a reference, not as a basis for trading.
策略仅供参考 不做交易依据
Copyright © 2024 UK UNITED PUHUI TECHNOLOGY CO., LTD,企业编号:11097854
