
MHMarkets:December 20- MHM European Perspective

Market Overview
On Tuesday, December 20, Beijing time, during the Asian and European session, spot gold rebounded again blocked and is currently trading near $ 1791.41 per ounce. The Bank of Japan unexpectedly relaxed the control of the yield curve, the yen rose sharply, the dollar index was dragged down, gold prices once rose to near 1796; but U.S. bond yields rose more aggressively, hitting a new high of more than three weeks, so that gold prices gave back some of the gains. At present, before the top break through the 1800 integer mark, the market is slightly biased towards the oscillation downward.
This trading day need to pay attention to the U.S. November annualized quantity of building permits and the U.S. November annualized quantity of housing starts, and also pay attention to the Fed officials' speeches.
Mohicans Markets strategy is only for reference and not for investment advice. Please carefully read the statement at the end of the text. The following strategy will be updated at 15:00 on December 20, 2022, Beijing time.
Technical Analysis
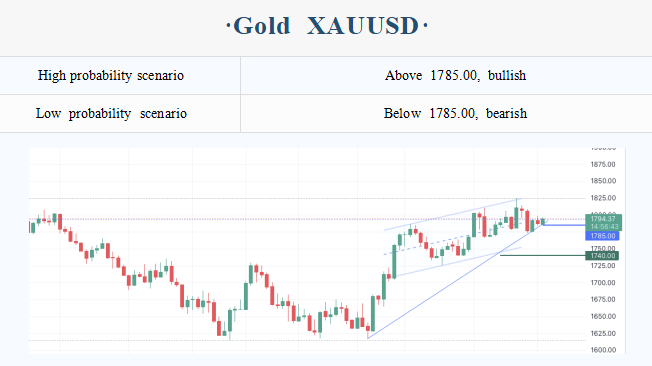
CME Group options layout changes (February Futures Price):
1840 Bullish decreased sharply, bearish unchanged, key resistance
1825 Bullish decreased sharply, bearish unchanged, resistance
1800 Bullish increased sharply, bearish increased, short-term key level
1790 Bullish slightly increased, bearish decreased, support level
1785 Bullish unchanged, bearish increased, short target
1760 Bullish decreased slightly, bearish increased, short target
Order flow key point marking (Spot Price):
1825 Key resistance
1813 High at Fed meeting, significant resistance
1806 Thursday's Asian starting point, resistance
1796 Second resistance during the day
1782 First support during the day
1773 Lower edge of the oscillator range in the second half of last week, key support
1765 Lower edge of the oscillator range since December, top-bottom transition, support level
Note: The above strategy was updated at 15:00 on December 20. This policy is a daytime policy. Please pay attention to the policy release time.
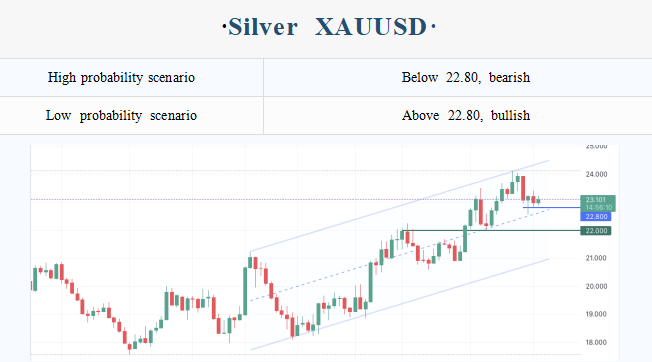
CME Group options layout changes (March Futures Price):
24 Bullish increased sharply and the stock was large, bearish increased slightly, long target
23.5 Bullish increased, bearish unchanged, long target
23 Bullish unchanged, bearish increased, short-term short target
22.5 Bullish increased, bearish decreased, support level
22.25 Bullish increased, bearish decreased, support level
22 Bullish increased slightly, bearish increased, short target
Order flow key point marking (Spot Price):
24-24.17 March double top neckline level, strong resistance area
23.40-23.43 Double top resistance, second resistance
23.25-23.30 Strong resistance during the day
23.10 First resistance level during the day, Asian and European markets can first focus on this resistance
22.86-22.90 First support during the day
22.57 Long key defensive level, important support
22 Support level
21.55 Powell's speech at the beginning of the rally point, important support
Note: The above strategy was updated at 15:00 on December 20. This policy is a daytime policy. Please pay attention to the policy release time.
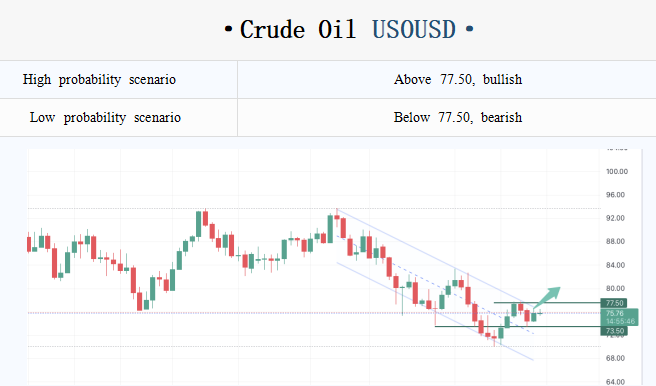
Change of CME Group option layout (futures price in February):
80 Bullish decreased significantly, but the stock was huge. Bullish increased slightly, bullish targets
76 Bullish and bearish increased significantly, breaking through stability, focusing on upward action
75 Bullish and bearish have increased significantly, with long short competition and support position
73 Bullish slightly increased, bearish sharply increased, short target
72 Bullish slightly reduced, bearish sharply increased, short target
69.5-70 Bullish slightly increased, bearish significantly increased, short target area
Order flow key point marking (spot price):
79-80 Strong resistance zone
77.8-78 Double top resistance, key point
76.6 First resistance level, breaking through the previous high
75.33 For the first support position, pay attention to the support of this level first
74.35 Second support
73-73.5 Key support areas
71-71.3 Starting point, support area
70 Front low, double bottom support area
Note: The above strategy was updated at 15:00 on December 20. This policy is a daytime policy. Please pay attention to the policy release time.
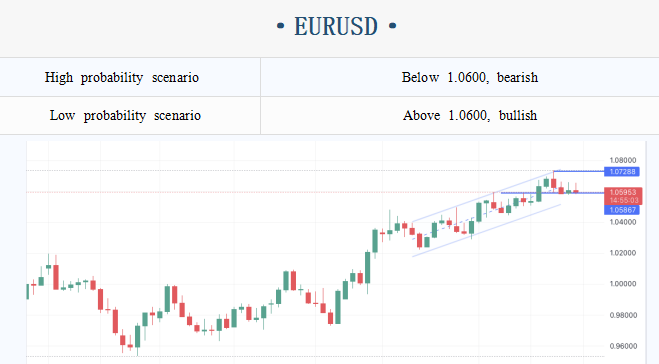
Change of CME Group option layout (futures price in January):
1.07 Bullish increased, bearish increased and the stock was large, long target and resistance
1.065 Bullish slightly increased, bearish slightly increased, resistance
11.06 Bullish slightly increased, bearish slightly increased, rebound target and resistance
1.0575 Bullish slightly increased, bearish unchanged, key support
1.055 Bullish unchanged, bearish increased, falling target
1.05 Bullish unchanged but large stock; Bearish unchanged but large stock; short target and support
11.045 Bullish slightly decreased, bearish increased, short target
Note: The above strategy was updated at 15:00 on December 20. This policy is a daytime policy. Please pay attention to the policy release time.
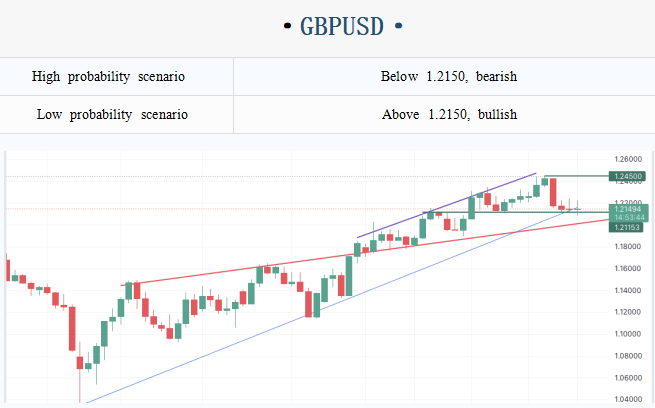
CME Group data today:
1.23 Bullish slightly increased, bearish slightly decreased, long target
1.222 Bullish slightly increased, bearish unchanged, rebound target
1.21 Bullish unchanged, bearish slightly increased, falling target
1.205 Bullish unchanged, but the stock was large, bearish increased, and the falling target is also supportive
1.20-1.22 Bullish unchanged, bearish increased, short target
1.195 Bullish slightly decreased, bearish slightly increased, short target
Note: The above strategy was updated at 15:00 on December 20. This policy is a daytime policy. Please pay attention to the policy release time.
Statement | Disclaimer
Disclaimer: The information contained in this material is for general consultation only. It does not take into account your investment objectives, financial situation or special needs. We have made every effort to ensure the accuracy of the information as of the date of publication. MHMarkets makes no warranty or representation on this material. The examples in this material are for illustrative purposes only. To the extent permitted by law, MHMarkets and its employees shall not be liable for any loss or damage arising from any information provided or omitted in this material in any way (including negligence). The characteristics of MHMarkets' products, including applicable fees and charges, are outlined in the product disclosure statement provided on MHMarkets' website. Derivatives may be risky; The loss may exceed your initial payment. MHMarkets recommends that you seek independent advice.
MohicansMarkets, (abbreviation: MHMarkets or MHM, Chinese name: Maihui), Australian Financial Services License No. 001296777.