
MHMarkets:12.16-MHM European Viewpoint

Market Overview
On Friday (December 16), Beijing time, the rebound of spot gold was blocked during the Asian European session. At present, the trading was near 1781 US dollars/ounce. The last trading day, due to the sharp rise of the US dollar, the gold price fell back to below 1800 again and fell below the 200 day moving average. The top signal of "Twilight Star" appeared again on the technical side, and the signal of gold price reaching the top in the short term was significantly enhanced, so it is necessary to guard against the risk of further decline of gold price.
In terms of fundamentals, after the hawkish interest rate cut by the Federal Reserve and the hawkish speech by Federal Reserve Chairman Powell, the Bank of England and the European Central Bank also raised interest rates by 50 basis points respectively, further increasing the opportunity cost of holding gold, which depressed the gold price.
Although the market's concern about the global economic recession has risen, and the gold ETF position has increased, more safe haven funds have poured into the US dollar, and gold with the nature of safe haven is still suppressed.
This trading day needs to focus on the December PMI data of European and American countries. The market is expected to be below 50 of the boom and bust line, which may further increase the risk aversion buying of US dollars. Investors need to be alert.
Mohicans Markets strategy is only for reference and not for investment advice. Please carefully read the statement at the end of the text. The following strategy will be updated at 15:00 on December 16, 2022 Beijing time.
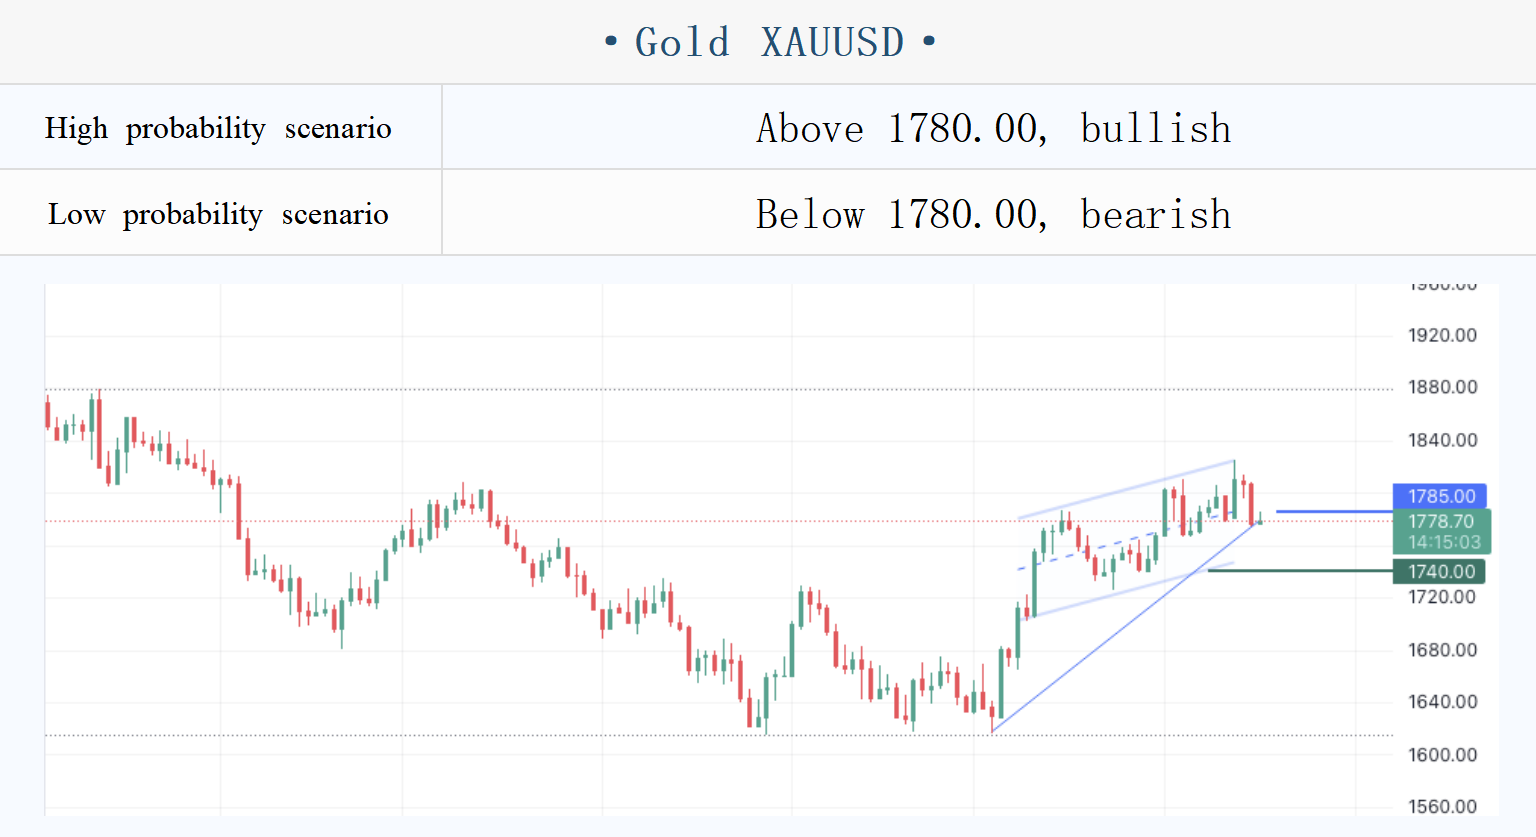
Change of CME Group's option layout (futures price in February):
1825 to 1830 Bullish sharply increased, and bearish slightly increased, with long target
1800 Bullish decreased, bearish increased, resistance level
1790 Bullish increased significantly, bearish decreased, short-term long target
1750 Bullish increased, bearish decreased significantly, and downward action weakened
Order flow key point marking (spot price):
1813 High point after the Fed meeting, important resistance
1806 The starting point and falling point of Asian market yesterday, resistance level
1795 Support to positive force
1786-1788 The boundary of long and short
1776 The upper edge of the shock range at the beginning of the month, the support level
1766-1770 Bulls' key defensive position, breaking alert triggers a new wave of downward movement
1747 The starting point and important position of Powell's speech at the beginning of the month
Note: The above strategy was updated at 15:00 on December 15. This policy is a daytime policy. Please pay attention to the policy release time.
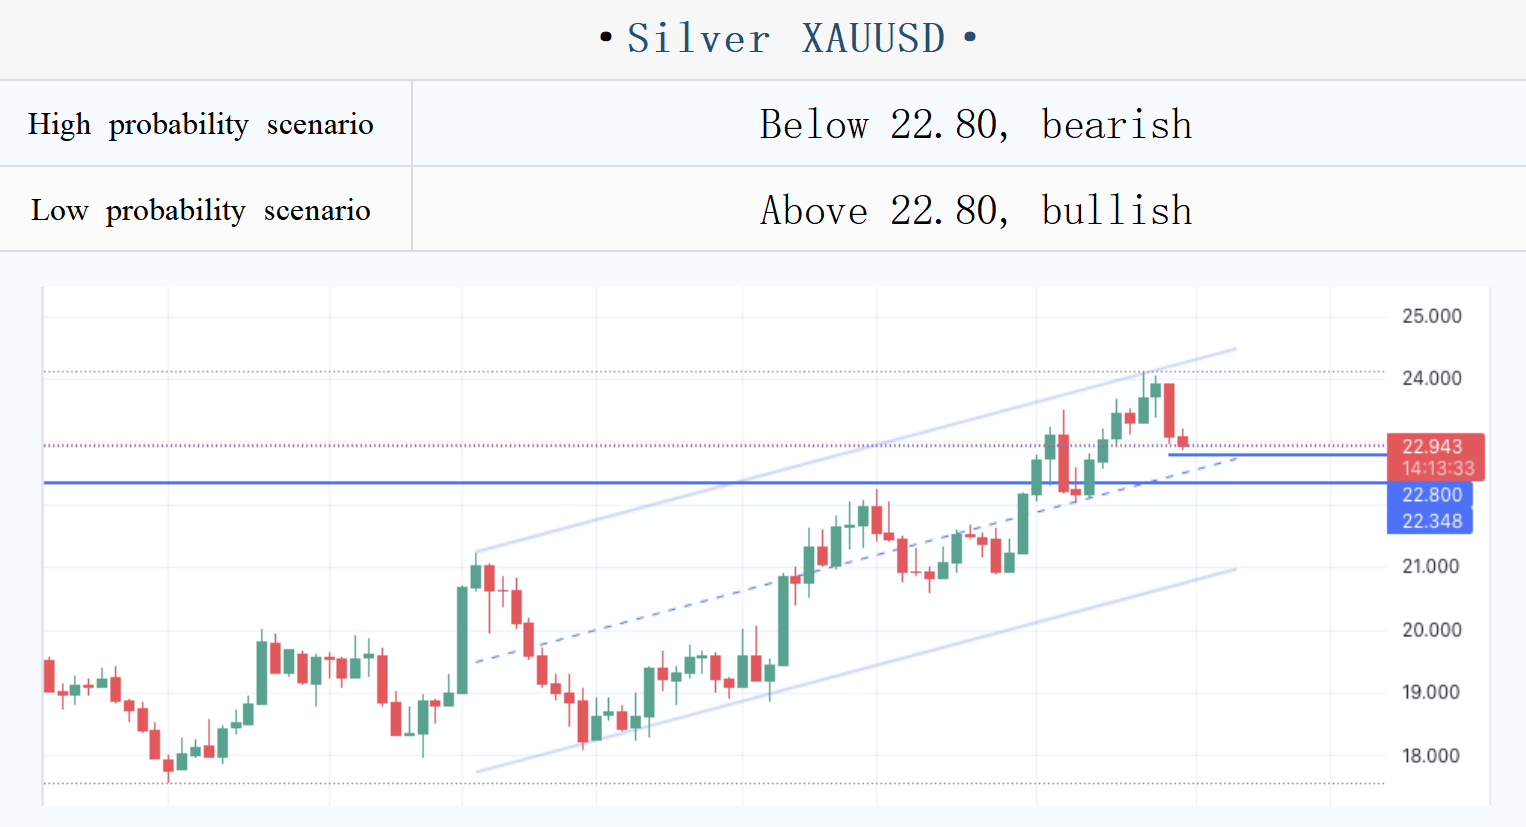
Change of CME Group option layout (futures price in March)
24 Bullish increased, bearish increased, long target
23.5 Bullish slightly increased, bearish slightly increased, and long and short positions were contested
23 Bullish sharply reduced, bearish increased, short-term short target
22.5 Bullish slightly reduced, bearish increased, short target
Order flow key point marking (spot price):
24.85-25 Long target
24.45-24.57 Secondary resistance
24-24.173 Double top neck line position, strong resistance area
23.4 First resistance, short line boundary of long and short targets
23 Important support of the day
22.57 Double bottom neckline support
22 Bulls' key defensive position, breaking alert triggers a new wave of downward movement
Note: The above strategy was updated at 15:00 on December 15. This policy is a daytime policy. Please pay attention to the policy release time.
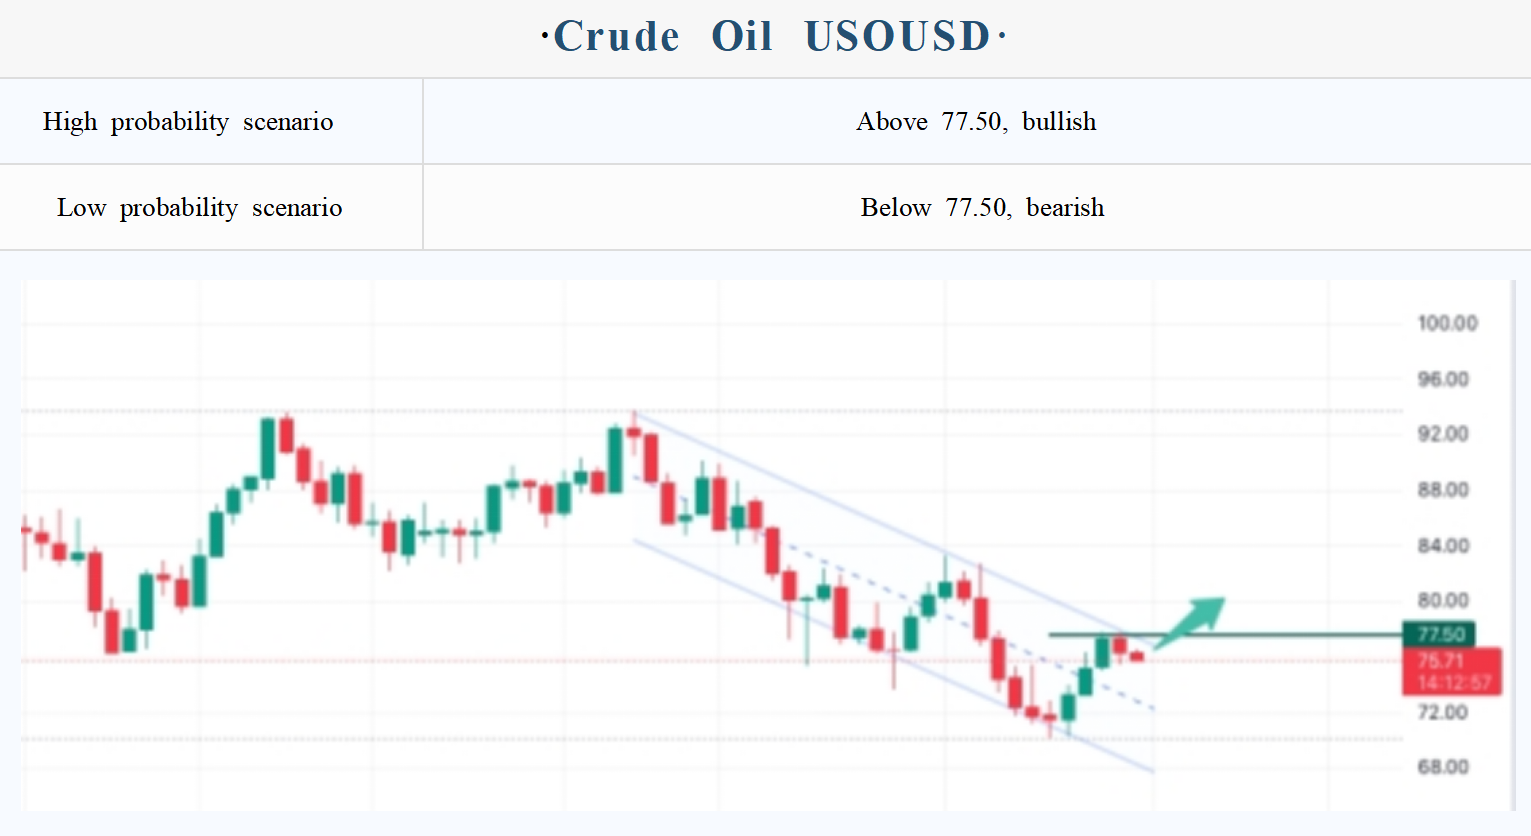
CME Group options layout changes (January Futures Price):
78 Bullish increased sharply, bearish decreased slightly, long target
77 Bullish increased sharply, bearish increased, long target, resistance
76 Bullish decreased, bearish increased, resistance
75 Bullish decreased, bearish decreased, support
73 Bullish decreased slightly, bearish decreased sharply, short target
72 Bullish increased sharply, bearish increased, support
Order flow key point marking (Spot Price):
81.3 Start of previous decline, key resistance
79-80 Rebound target area for bullish option bets, also poses resistance
77.8-78 Double top high, key resistance area
76.4 Thursday's support turned into resistance, first resistance level during the day
75-75.4 Long-short boundary, key support area
73.8-74 Support area
72.8 Key support for upward trend
Note: The above strategy was updated at 15:00 on December 16. This policy is a daytime policy. Please pay attention to the policy release time.
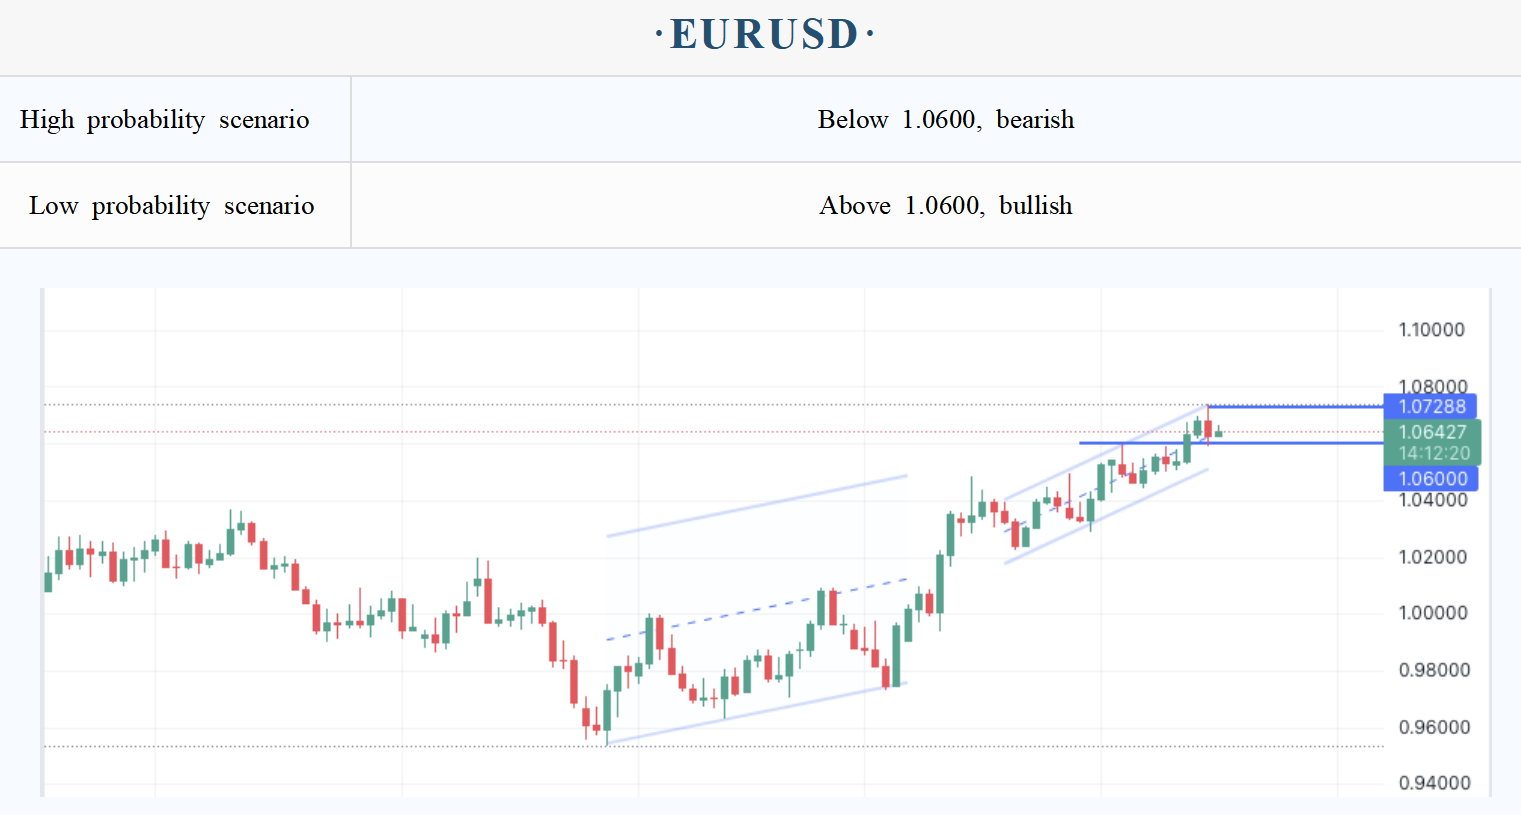
Today’s CME Group data:
1.0775-1.08 Bullish increased sharply, bearish increased slightly, long target
1.07 Bullish increased sharply, bearish increased sharply and the stock was large, rebound target and positive force
1.065-1.0675 bullish increased significantly, bearish increased sharply, resistance range
1.06 Bullish decreased slightly, bearish increased sharply, fallback target and support
1.055 Bullish decreased slightly, bearish increased sharply, short target
1.05 Bullish increased slightly, bearish decreased sharply, important support
Note: The above strategy was updated at 15:00 on December 16. This policy is a daytime policy. Please pay attention to the policy release time.
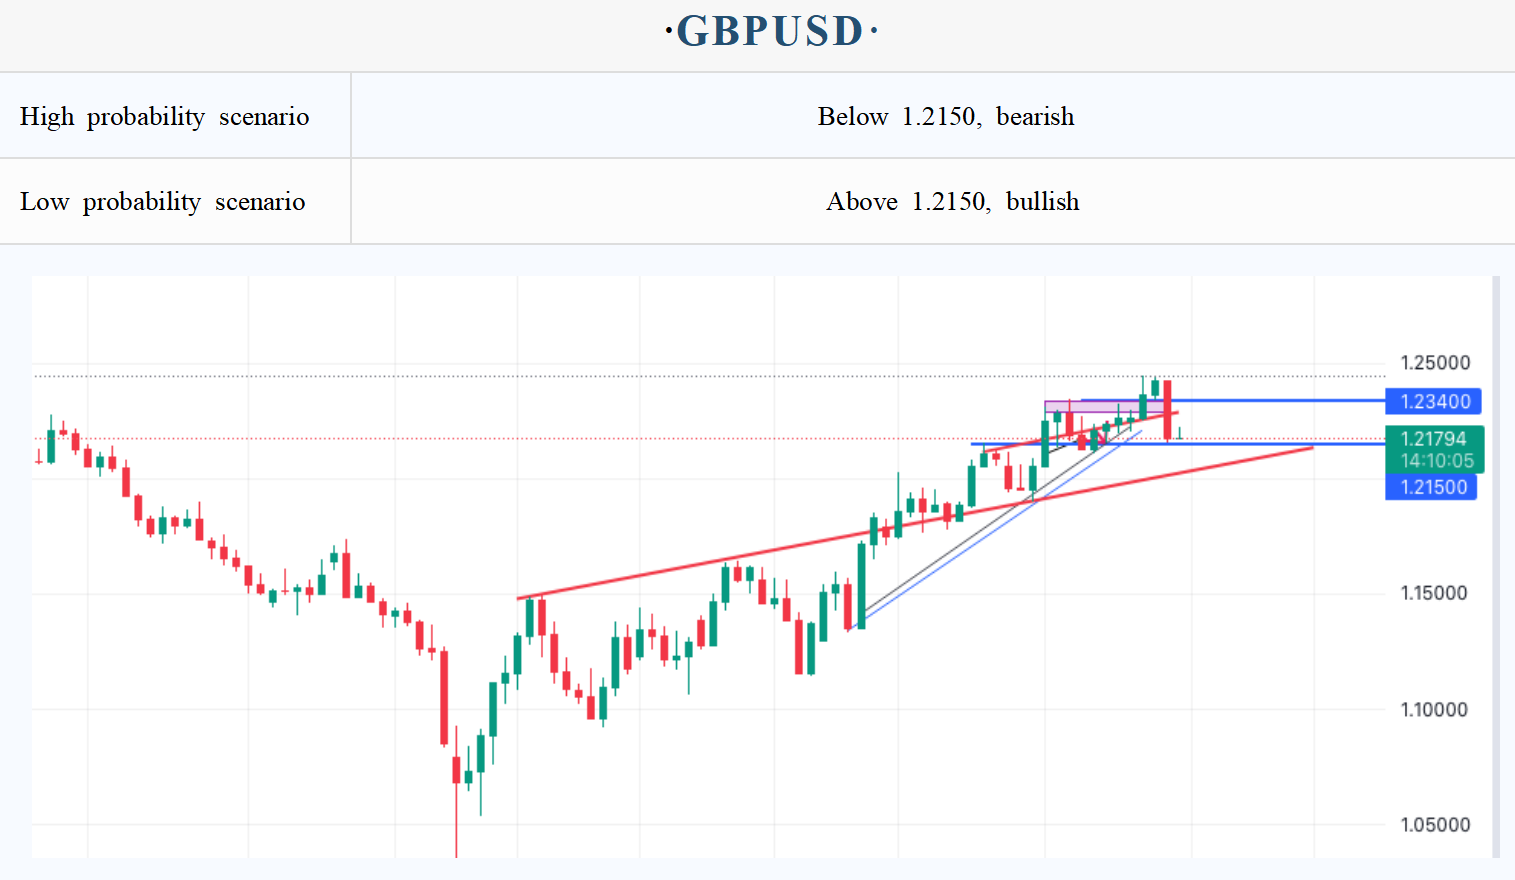
Today’s CME Group data:
1.235-1.237 Bullish unchanged, bearish decreased slightly, long target
1.23 Bullish decreased, bearish increased slightly, next resistance
1.22-1.222 Bullish increased sharply, bearish increased sharply, first resistance
1.215-1.217 Bullish increased sharply, bearish increased, support
1.21 Bullish unchanged, bearish increased slightly, fallback target
1.205 Bullish unchanged but the stock was large, bearish unchanged, support
1.195 Bullish unchanged, bearish increased sharply, short target
Note: The above strategy was updated at 15:00 on December 16. This policy is a daytime policy. Please pay attention to the policy release time.
Statement | Disclaimer
Disclaimer: The information contained in this material is for general consultation only. It does not take into account your investment objectives, financial situation or special needs. We have made every effort to ensure the accuracy of the information as of the date of publication. MHMarkets makes no warranty or representation on this material. The examples in this material are for illustrative purposes only. To the extent permitted by law, MHMarkets and its employees shall not be liable for any loss or damage arising from any information provided or omitted in this material in any way (including negligence). The characteristics of MHMarkets' products, including applicable fees and charges, are outlined in the product disclosure statement provided on MHMarkets' website. Derivatives may be risky; The loss may exceed your initial payment. MHMarkets recommends that you seek independent advice.
MohicansMarkets, (abbreviation: MHMarkets or MHM, Chinese name: Maihui), Australian Financial Services License No. 001296777.