
MHMarkets:European Perspective-October 25-European Perspective

On Tuesday, October 25, during the Asian session, spot gold narrowly oscillated, and is currently trading near $ 1648 per ounce; the market reduced expectations for the Federal Reserve to raise interest rates in December by 75 basis points, U.S. bond yields fell slightly, providing support to gold prices; but the market is expected this week, the European Central Bank is likely to raise interest rates by 75 basis points, which is expected to come out this week, the U.S. third-quarter GDP will rise year-on-year 2.1%; U.S. PCE for September will also be at a high level, making the bulls wary; U.S. crude oil narrowly oscillated, and is currently trading near $84.77 per barrel; OPEC+ news this week is relatively small, the market wait-and-see sentiment is strong. On the one hand, the poor performance of PMI data for October in Europe and the United States on Monday increased market concerns about the global recession and the outlook for crude oil demand; but on the other hand, market expectations of a 75 basis point Fed rate hike in December weakened, and stock markets in Europe and the United States generally rose, again providing support for oil prices.
Mohicans Markets strategies are for information purposes only and are not intended as investment advice, please read the disclaimer at the end of the article. The following strategies were updated on October 25, 2022 at 15:30 BST.
Technical Analysis
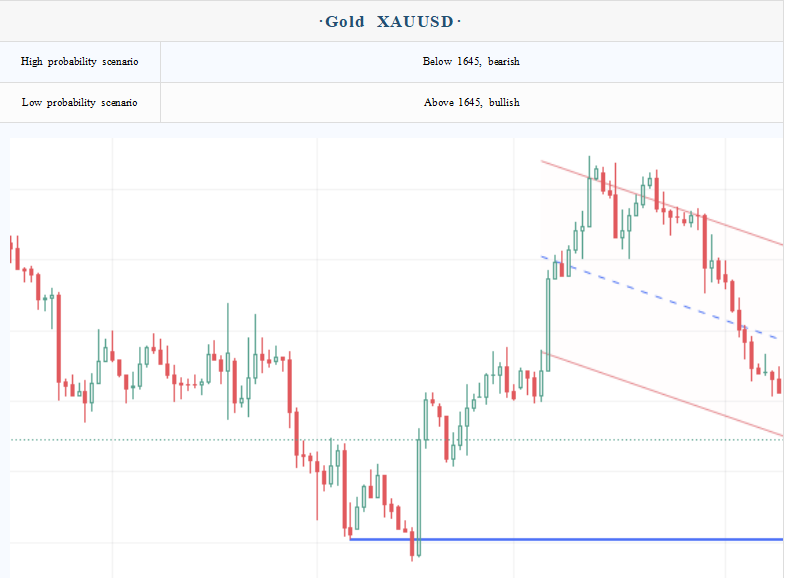
CME Group options layout changes (December Futures Price):
1690 Bullish increase sharply, bearish decrease slightly, key resistance
1675 Bullish increase sharply, bearish increase slightly increase, sentiment dividing point between long and short
1660 Bullish increase, bearish decrease sharply and the stock is large, resistance weaken
1650 Bullish unchanged, put options -27, key support
1640 Bullish unchanged, bearish decrease but the stock is large, short first target
1620-1630 Bullish decrease slightly, bearish increase sharply but the stock is large, short concentration target
Order flow key point marking (Spot Price):
1682-1684 Mid-term resistance
1670-1672 Key resistance in a day
1662 Weak resistance
1653 Asian session short term key level (Asian session only!)
1645-1648 Long-short boundary in a day
1637 Key trend support
1624 Important support
Note: The above strategy was updated at 15:00 on October 25. The strategy is a daytime strategy, please note the strategy release time.
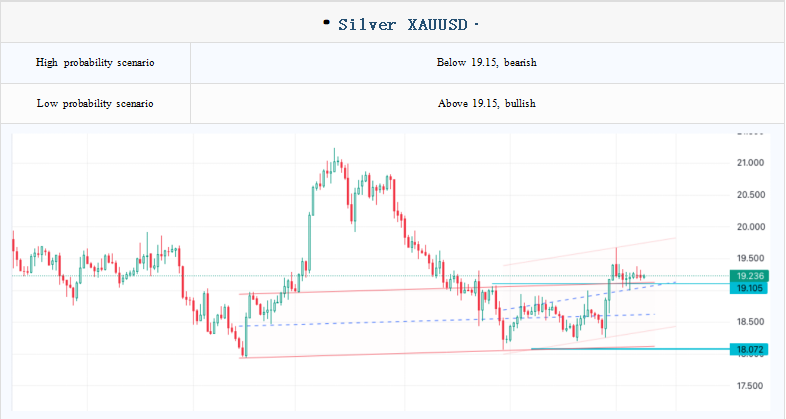
CME Group options layout changes (December Futures Price):
20 Bullish decrease but the stock is large, bearish unchanged, key resistance
19.75 Bullish decrease slightly, bearish unchanged, resistance
19.5 Bullish increase slightly, bearish decreasing, long target
19.2 Bullish increase, bearish increase slightly, support
19 Bullish decrease, bearish increase slightly, short target and support
18.75 Bullish unchanged, bearish decrease slightly, support
Order flow key point marking (Spot Price):
19.9-20 Trend key resistance
19.7 Resistance in a day
19.38 Resistance
19 Key support in a day
18.6 First support level, break below 18-18.3 important support area
18-18.3 Important support area
Note: The above strategy was updated at 15:00 on October 25. The strategy is a daytime strategy, please note the strategy release time.
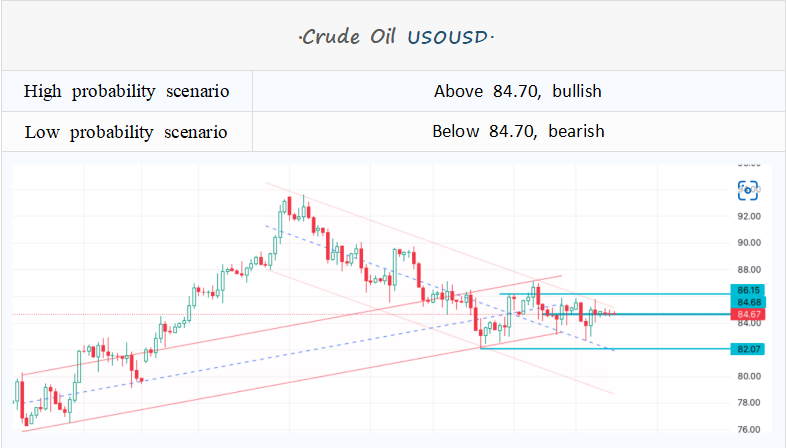
Key point marking of order flow (futures price in December):
90 Bullish increased significantly and stocks were large, while bearish decreased but stocks were large, with a long target
88 Bullish increased, bearish unchanged, long target and resistance
84.5-85 Bullish greatly reduced but the stock was large, put options+265 lots and the stock was large, and the resistance range
82 Bullish slightly reduced, bearish sharply increased, short target
80 Bullish decreased significantly but the stock was large; bearish decreased significantly but the stock was large, the key support
Order flow key point marking:
88.6-89 Key resistance during the day
87 Key resistance in short term, breakthrough look at88.6-89
86 First resistance during the day
84 First support
82.6 Support during the day
81.24-81.8 Key support, breakthrough likely to open a new round of downward movement
80 Key position
Note: The above strategy was updated at 15:00 on October 25. This policy is a daytime policy. Please pay attention to the policy release time.
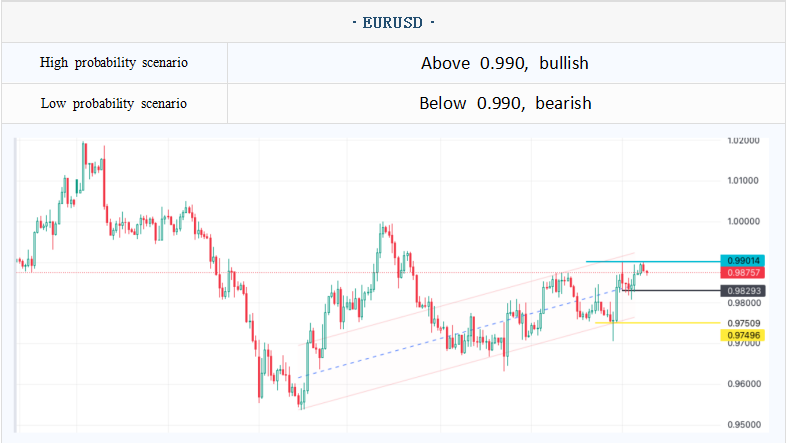
Technical Analysis
1.00 Bullish sharply reduced, but the stock was large, while bearish slightly increased, with long target and resistance
0.995 Bullish decreased, bearish increased significantly, next resistance
0.99 Bullish slightly decreased, bearish slightly increased and stocks were large, the first resistance
0.985 Bullish slightly increased, bearish slightly decreased, but the stock was large, and the fall back target was also a support
0.98 Bullish unchanged, but the stock was large, and the bearish slightly reduced, the important support
0.975 Bullish slightly increased, bearish slightly decreased, but the stock was large, short target and support
Note: The above strategy was updated at 15:00 on October 25. This policy is a daytime policy. Please pay attention to the policy release time.
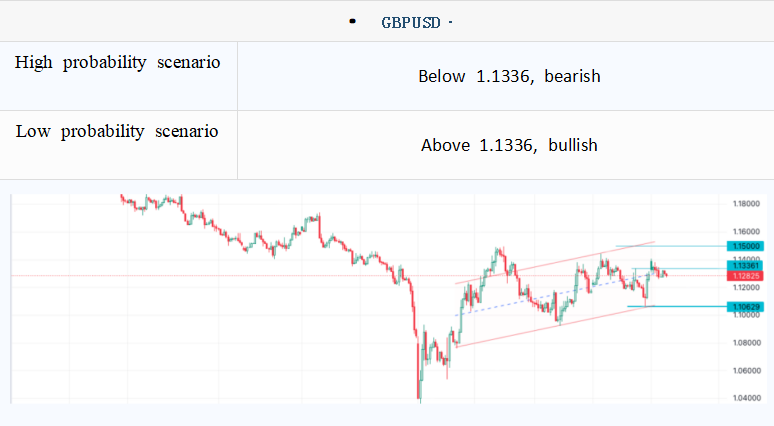
Changes of CME Group's option layout:
1.15 Bullish decreased but stock was large, bearish unchanged, and long target and resistance
1.14 Bullish unchanged, bearish slightly increased, and the next resistance
1.135 Bullish slightly reduced but the stock was large, bearish unchanged, rebound target and resistance
1.132 Bullish unchanged, bearish slightly increased, the first resistance
1.125-1.127 Bullish slightly decreased, but the stock was large. Bullish slightly increased, and the support was weakened
1.12 Bullish unchanged, bearish reduced but the stock was large, and the short target was also supported
1.11 Bullish decreased, bearish slightly increased and the stock was large, the next short target
Note: The above strategy was updated at 15:00 on October 25. This policy is a daytime policy. Please pay attention to the policy release time.
Special explanations:
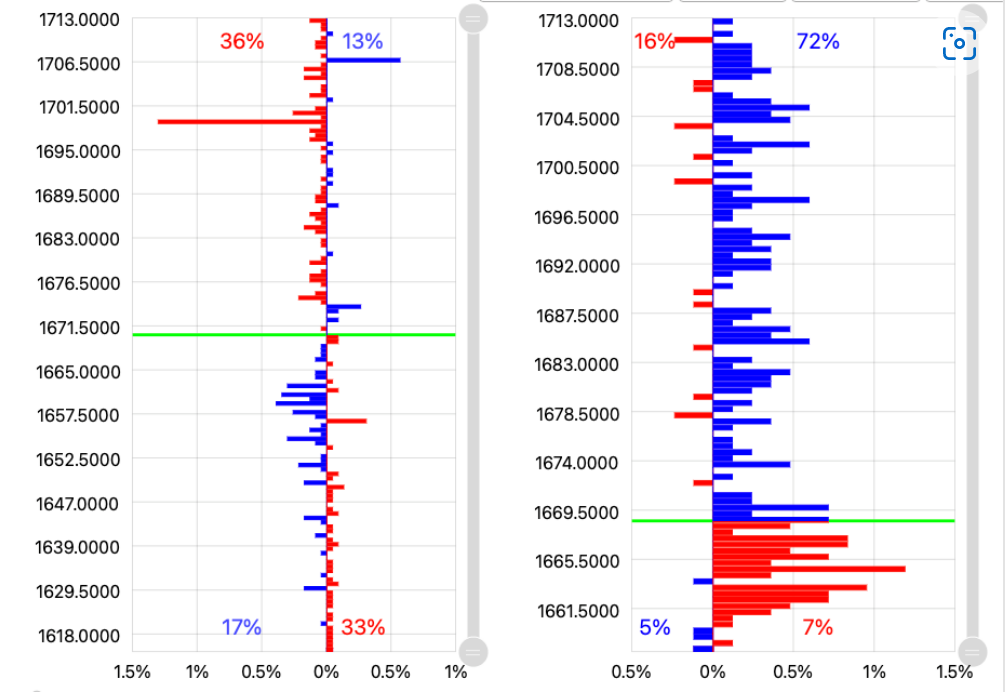
This paper involves the key point marking and technical analysis of spot gold, spot silver and US crude oil. Refer to the change data of options positions published on the official website of CME and the average order flow change data of large brokers in the industry. Starting from the market chip distribution, it is more accurate to mark the market trading sentiment within the important price range.
The order flow mainly refers to the following Oder Book data updated every 20 minutes, taking XAUUSD international gold as an example:
Disclaimer
Disclaimer: The information contained in this material is for general advice only. It does not take into account your investment goals, financial situation or special needs. We have made every effort to ensure the accuracy of the information as of the date of publication. MHMarkets makes no warranties or representations about this material. The examples in this material are for illustration only. To the extent permitted by law, MHMarkets and its employees shall not be liable for any loss or damage arising in any way, including negligence, from any information provided or omitted from this material. The features of MHMarkets products, including applicable fees and charges, are outlined in the product disclosure statements available on the MHMarkets website. Derivatives can be risky and losses can exceed your initial payment. MHMarkets recommends that you seek independent advice.
Mohicans Markets, (Abbreviation: MHMarkets or MHM, Chinese name: Maihui), Australian Financial Services License No. 001296777.