
MHMarkets:October 13--MHM European Market

Market Review
On Thursday, October 13, during the Asian period, the spot gold shock fell slightly, and currently traded at $ 1670 per ounce. Although there were some pigeons in the Federal Reserve meeting overnight, there were some pigeons that have provided support for gold prices, the market generally pays attention to this evening’s US CPI data for September; the market is generally expected that U.S. inflation will continue to be stubbornly high, which will promote the Federal Reserve to continue to increase interest rate hikes. This provides support for the US dollar and puts the price of gold. At present, the market has a strong mood, and the overall trading is limited.
U.S. crude oil has hovered at a low level in the past week, and currently trades nearly $ 87.05 per barrel; the market is concerned that the further interest rate hikes of most central banks around the world will exacerbate the risk of economic recession, which suppresses the prospects of crude oil demand; OPEC’s monthly report and EIA’s monthly report also lowered crude oil demand growth expectations, while a larger-than-expected increase in API crude oil inventories and an unexpected increase in gasoline stocks also dampened the morale of bulls; Short-term bearish technical signals have also increased after Wednesday's high retreat, with oil prices facing further downside risks in the short term.
The focus of this trading day is on the EIA crude oil inventory series, the U.S. CPI data for September and changes in Fed rate hike expectations, keeping an eye on changes in initial jobless claims and news related to the geopolitical situation.
Mohicans Markets strategy is for reference only and not as investment advice. Please read the terms of the statement at the end of the article carefully. The following strategy was updated at 15:30 on October 13, 2022, Beijing time.
Technical Analysis
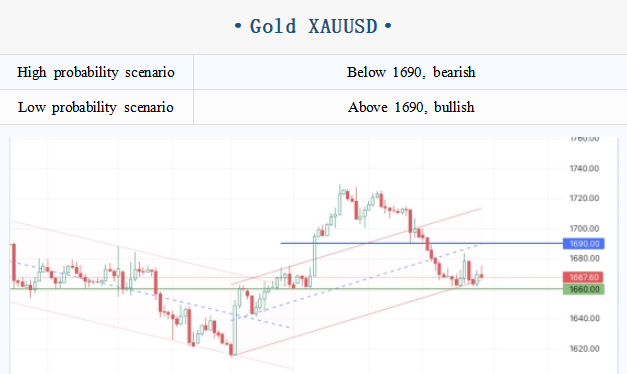
CME Group options layout changes(December Futures price):
1745-1750 Bullish increase sharply, bearish increase slightly, long target area
1700 Bullish increase sharply, bearish decrease slightly, long target
1685-1690 Bullish increase slightly, bearish increase, key resistance area in a day
1670 Bullish increase slightly, bearish increase slightly, support level
1650 Bullish unchanged, bearish increase sharply, short target
1620-1630 Bullish unchanged, bearish decrease, mitigating the decline
Order flow key point labeling(spot price):
1707 Resistance level
1689-1694 Top-bottom conversion range, rebound key resistance area
1677.5 The opening price of the K-line with significantly larger volume, the more critical resistance level in a day
1668 The first resistance level in a day, below this level indicates a weak rebound momentum
1660 Near last Monday’s opening price, the 618 retracement, the current key support
1654-1657 Weak support range
1642-1644 End-September retracement of the upside, support range
1625 key level, during the 1633 may have a certain buffer role
Note: The above strategy was updated at 15:00 on October 13. This strategy is a day strategy, please pay attention to the release time of the strategy.
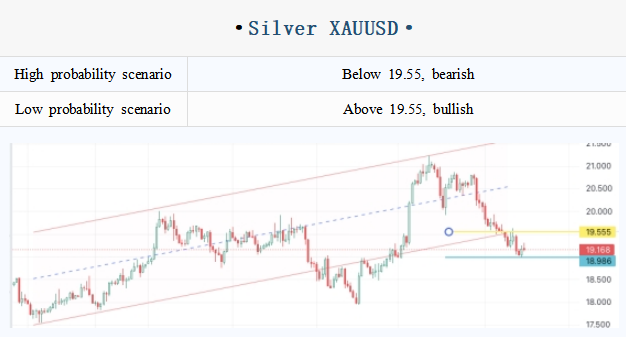
CME Group options layout changes:
20 Bullish increase, bearish decrease slightly, long target
19.75 Bullish decrease, bearish unchanged, weaken upside momentum
19.50 Bullish decrease slightly, bearish decrease slightly, resistance
19.25 Bullish increase slightly, bearish decrease slightly, bounce target
18.95-19 Bullish increase, bearish decrease, key level
18.75 Bullish increase slightly, bearish decrease slightly, support
18.65 Bullish unchanged, bearish increase slightly, short target
Order flow key point labeling(spot price):
20.5 Second highest rally point of Non-farm post, strong resistance
19.95 Short-term key support lost, turned into important resistance
19.75 First resistance in a day, long-short boundary
19.46 Trend support, loss of bullish sentiment destroyed
19-19.25 Rise zone on Monday, this round of rallies in the long cost area
Note: The above strategy was updated at 15:00 on October 13. This strategy is a day strategy, please pay attention to the release time of the strategy.
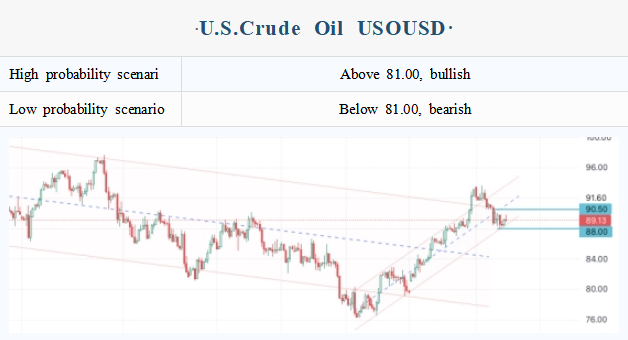
CME Group options layout changes(November Futures price):
90 Bullish increase sharply, bearish increase sharply, long target
89 Bullish increase sharply, bearish decrease slightly, long target
87.5 Bullish increase sharply, bearish decrease sharply, demarcation point between long and short
86.5 Bullish increase sharply, bearish increase, support level
85 Bullish increase, bearish decrease sharply, support level
Order flow key point labeling:
90-90.5 A key resistance area again, break above to focus on further rebound momentum
89 PPI data after the acceleration of the decline point, strong resistance in a day
87.75-88 Important support turns into resistance, multi-short division in a day
86.7 First support in a day, short term can be referred to
85-85.3 The lowest point of the day of the OPEC meeting, the limit of multiple support
Note: The above strategy was updated at 15:00 on October 13. This strategy is a day strategy, please pay attention to the release time of the strategy.
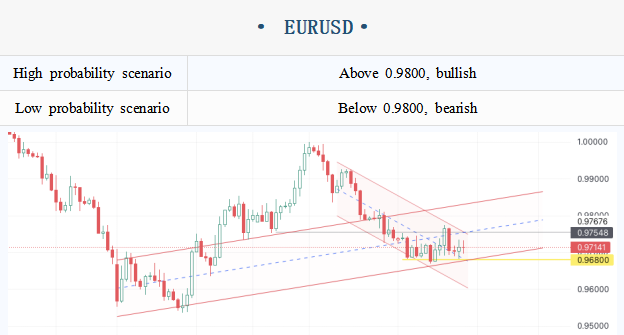
Technical Analysis
Change of CME Group's option layout:
0.98 Bullish increase significantly, bearish decrease slightly, long target
0.975 Bullish slightly increased, bearish increased with large stock, resistance level
0.9725 Bullish and bearish increased significantly, rebound target and resistance
0.97 Bullish unchanged, bearish reduced, support level
0.965 Bullish unchanged, bearish unchanged but large stock, falling target
0.96 Bullish unchanged, bearish slightly increased and the stock was large, short target
0.955 Bullish remained unchanged, bearish decreased and stocks were large, short target and support
Note: The above strategy was updated at 15:00 on October 13. This policy is a daytime policy. Please pay attention to the policy release time.
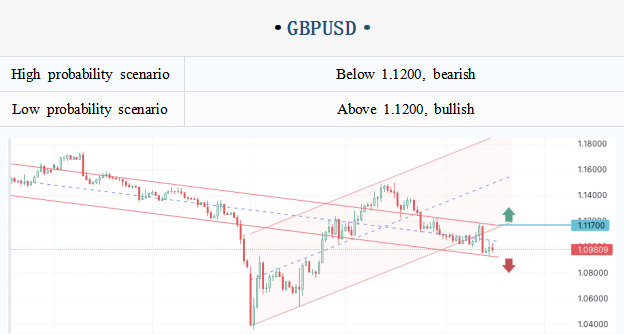
Change of CME Group's option layout:
1.127-1.13 Bullish increased, bearish slightly increased, long target
1.12 Bullish slightly increased, bearish slightly decreased, next rebound target
1.11 Bullish and bearish increase slightly, rebound target and resistance
1.105 Bullish remains unchanged, slight decrease in bearish period but large stock, and the target falls back
1.10 Bullish slightly reduced, bearish period slightly reduced, but the stock was large, short target and support
1.095 Bullish slightly increased, bearish slightly increased and stocks were large, short target
Special Instructions:
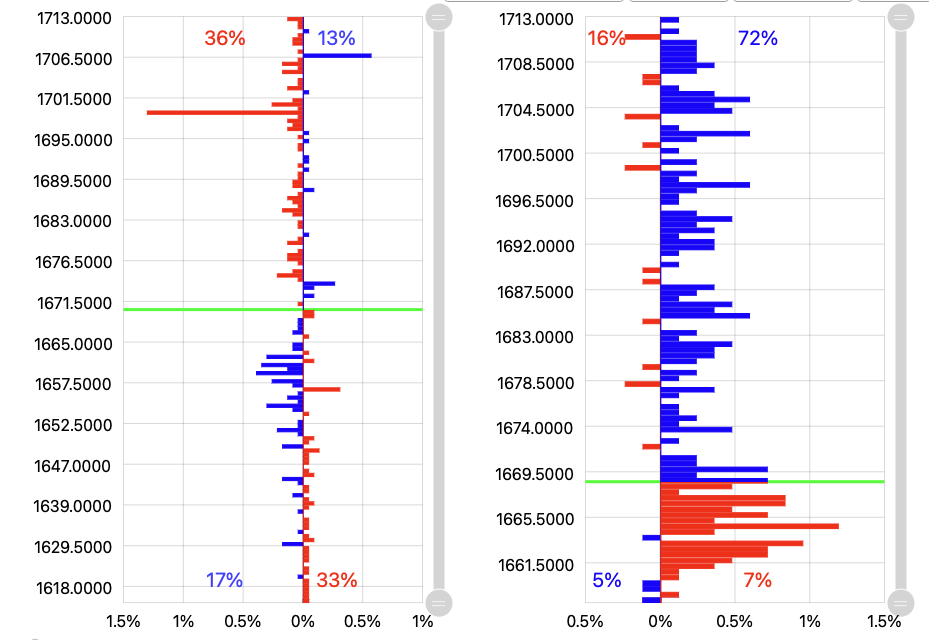
This paper involves the key point marking and technical analysis of spot gold, spot silver and US crude oil. With reference to the change data of options positions published on the CME official website and the average order flow change data of large brokers in the industry, the paper accurately marks the market trading sentiment within the important price range from the market chip distribution.
The order flow mainly refers to the following Oder Book data updated every 20 minutes, taking XAUUSD international gold as an example:
Disclaimer
Disclaimer: The information contained in this material is for general advice only. It does not take into account your investment goals, financial situation or special needs. We have made every effort to ensure the accuracy of the information as of the date of publication. MHMarkets makes no warranties or representations about this material. The examples in this material are for illustration only. To the extent permitted by law, MHMarkets and its employees shall not be liable for any loss or damage arising in any way, including negligence, from any information provided or omitted from this material. The features of MHMarkets products, including applicable fees and charges, are outlined in the product disclosure statements available on the MHMarkets website. Derivatives can be risky and losses can exceed your initial payment. MHMarkets recommends that you seek independent advice.
Mohicans Markets, (Abbreviation: MHMarkets or MHM, Chinese name: Maihui), Australian Financial Services License No. 001296777.