
MHMarkets:U.S. Inflation Pressure Eased in July,Goldman Sachs Cuts Gold Forecast

Key Data
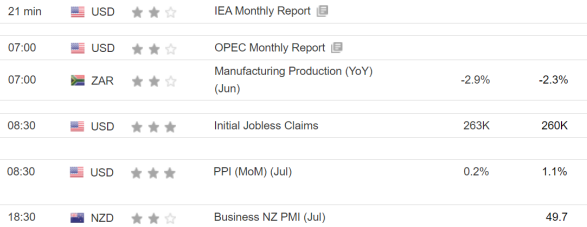
Fundamentals Overview
On Wednesday,August 10, the spot gold fell slightly during the pressure plate, and was blocked below the pivot point at 1794.76, and the first support was at 1783.24. The first support for spot silver is 21.37. WTI crude oil traded in a narrow range above the pivot point of 90.75, with the primary upside target focusing on 92.49. The U.S. dollar index extended losses at noon and is currently testing the first support level at 105. The euro rose against the dollar in the short-term, challenging the first resistance at 1.0328. GBP/USD is also testing the first resistance at 1.2226. USD/JPY fell below the first support at 132.69.
The Mohicans Markets strategy is for reference only and not as investment advice. Please read the terms of the statement at the end of the article carefully.
The following strategy was updated at 16:30 on August 11, 2022, Beijing time.
Techinical View
ONE · Techinical Level · International Gold
Technical Analysis
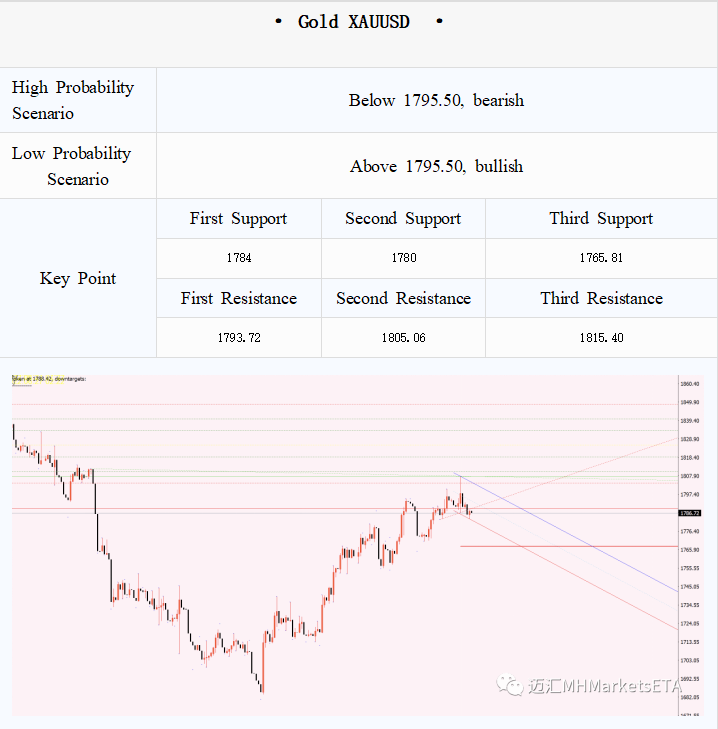
Last night, the US CPI data dropped from a high level, spot gold rose
first and then fell, and the trading volume has remained high, indicating that
the game of funds is very fierce around 1800. However, there has not been
much increase in the positions of the main gold contracts, indicating that the mediumand long-term funds have not really entered the market, and there may be a demand for short-term gold to fall.
At present, the sentiment of options is relatively stalemate. The 1765-1785call and put options have left the market, and the 1790-1805 range is long
and short, indicating that institutional funds are most concerned about the
breakdown of this range. If it can stabilize in this range within days, it may
attract medium and long-term capital layout and determine the next direction.
If you can't stand firm, the market may fluctuate greatly regardless of whether
it is going up or down, and it is hard to tell the trend.
Note: The above strategy was updated at 16:00 on August 11. This strategy isa day strategy, please pay attention to the release time of the strategy.
TWO · Technical Level · Spot Silver
Technical Analysis
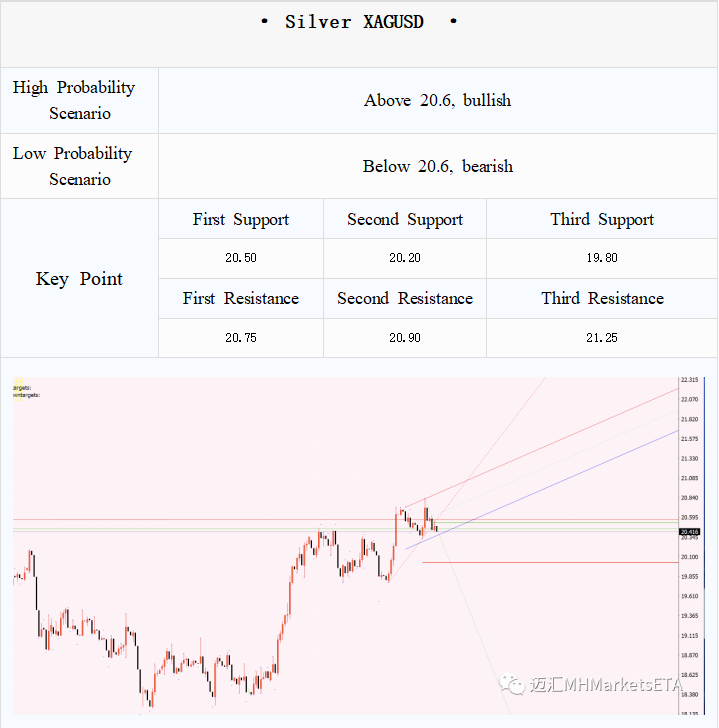
Silver rose first and then fell like gold on Wednesday, but the decline was
slightly smaller than that of gold. The 20.5 support level was still being testedin the Asian session on Thursday. When the price of gold is stagnant, it is
not ruled out that the silver short bean line suddenly changes, bringing new
trading opportunities, but the gap between the support and resistance of silver
is only about 0.3 US dollars, the fluctuation space is relatively small, and goldneeds to come out of new After the direction can be broken.
Note: The above strategy was updated at 16:00 on August 11. This strategy is a day strategy, please pay attention to the release time of the strategy.
THREE · Technical Level · US Crude Oil
Technical Analysis
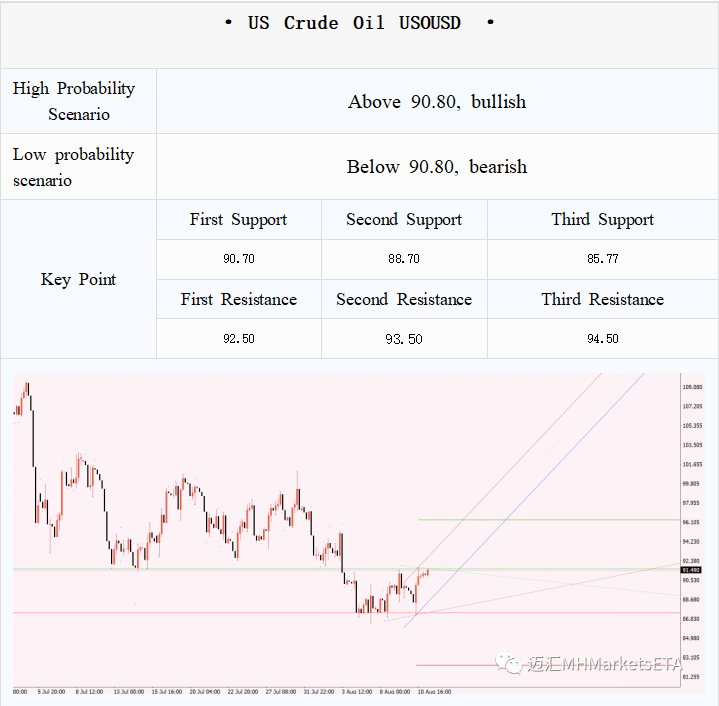
Crude oil fell on Wednesday due to the resumption of oil delivery from the
Druzhba pipeline from Russia to Europe, approaching the lower edge of the
shock range at 87.5 again, but then rebounded to 92.4 due to the surge in EIA gasoline demand, and finally the daily line closed with a bullish pinbar.
From the perspective of options and order flow, the overall new betting range has moved slightly higher than yesterday, about 88-95. The corresponding oil
price has bottomed out for a few days, which may be a signal that the
short-term difference is about to be seen, the top first pays attention to the
breakthrough of the 92.8 resistance at the upper edge of the shock range this week, and needs to stabilize before it is expected to look at the 95-96 midlineresistance area. The intraday limit rebounded at 97-98. The following focuses
on the support performance of 87-88. In the case of holding the lower edge
othe range, the market mainstream is still mainly selling high and buying low,and the short target is still 85.
Note: The above strategy was updated at 16:00 on August 11. This strategy isa day strategy, please pay attention to the release time of the strategy.
FOUR · Technical Level · EURUSD
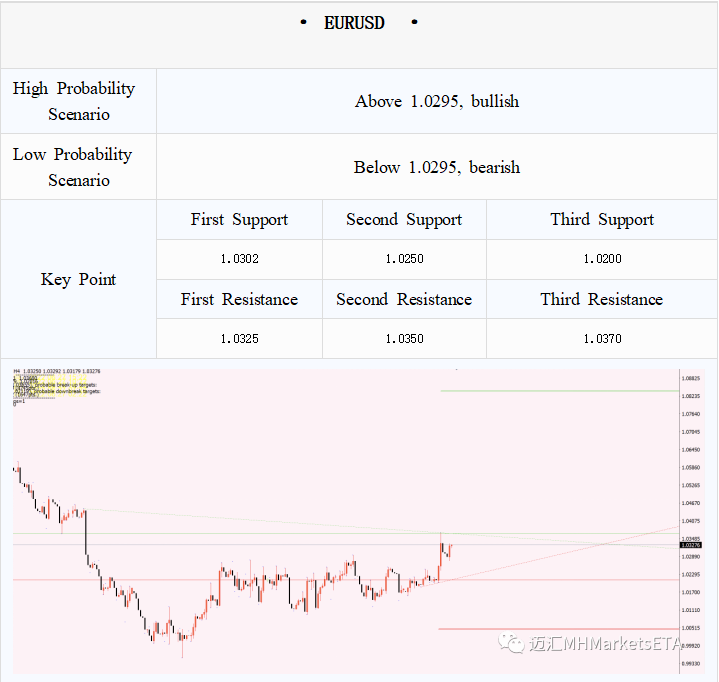
1.04 bullish increase, bearish increase greatly, strong resistance level 1.0375
bullish increase, bearish unchanged, long target 1.0325-1.0350 bullish slightly
increase, bearish increase, resistance area 1.03 bullish slightly decrease, bearish decrease but the stock is large, resistance 1.0250 bullish Decrease, bearish
increase, break will form resistance 1.02 bullish unchanged, bearish decrease,
support 1.01 bullish unchanged, bearish decrease, support
Technical Analysis
On Wednesday, the US CPI data for July was less than expected. Driven by
the weak dollar, the euro against the dollar tested the target range of 1.0350-1.04 suggested in yesterday's report, but fell back in late trading. From the
perspective of changes in order flow, Europe and the United States broke 1.03overnight to stimulate some bulls to increase their bets in the range of 1.0375-1.0550, but the fall in Europe and the United States in late trading may
invalidate the impact of the above call options on the short-term trend, and 1.04 also added a large number of bearish The bet is expected to pose strong
pressure on the upside of Europe and the United States. On the other hand,
the key level moved up to 1.0250, where 119 put options were added. If the
level is broken again, Europe and the United States will return to the range
shock, and the lower support looks at the lower edge of the shock range near 1.02.
Note: The above strategy was updated at 16:00 on August 11. This strategy is a day strategy, please pay attention to the release time of the strategy.
FIVE · Technical Level · GBPUSD
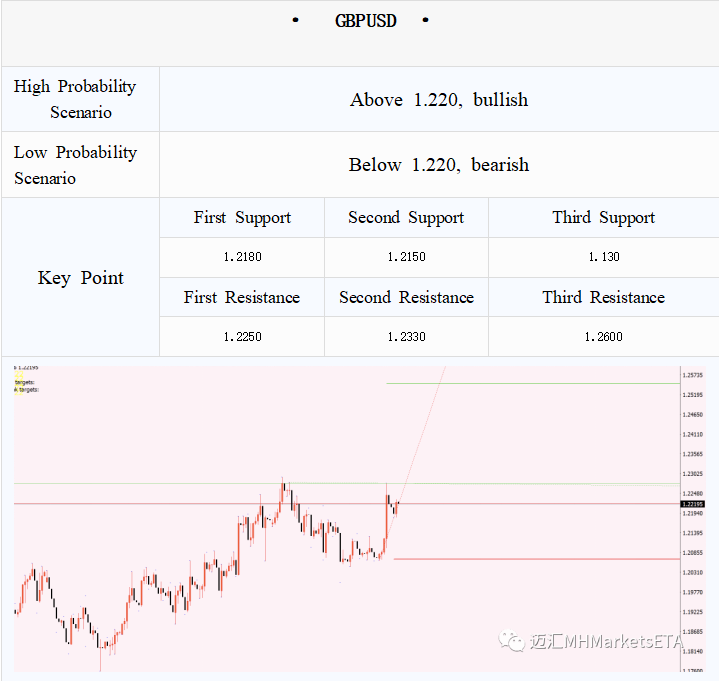
Technical Analysis
On Wednesday, the U.S. CPI data for July was less than expected,
causing the dollar to fall sharply. Affected by this, the pound and the dollar
climbed to 1.2275 for a while, but the trend fell back in late trading. The
decline continued at the opening today and is currently testing around 1.22.
From the perspective of changes in order flow, although the overnight
rally in GBPUSD has attracted some call options to increase their bets around 1.23 and 1.2650, the late fall may limit its further upward movement in the
short term. The current 1.2250 will constitute the first resistance level. If it
breaks below 1.22, the support will look at 1.2150, and if it falls further
below this level, the pound and the United States may return to the shock
range.
Note: The above strategy was updated at 16:00 on August 11. This strategy is a day strategy, please pay attention to the release time of the strategy.
SIX · Technical Level · AUDUSD
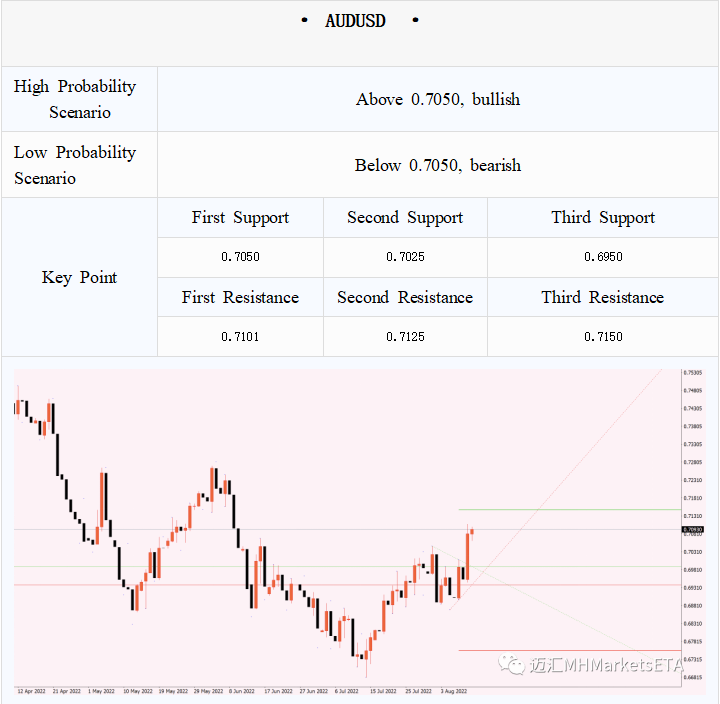
0.72 bullish increase, bearishness unchanged, the upper target 0.7150bullish
decrease, bearishness unchanged, weaken the upward momentum, resistance
level 0.7125 bullish slightly increased, bearish slightly increased, long and shortconfrontation resistance 0.71 bullish
increased substantially, bearish increased, the first upward move A target of
0.7050 is bullish unchanged, bearish decrease, support level 0.7025 bullish
increase, bearish unchanged, short-term support 0.6950 bullish decrease, bearishunchanged, key intraday support
Technical Analysis
On Wednesday, boosted by the US CPI data peaking and the weakening of
the dollar, the Australian dollar successfully broke through the daily rebound
and consolidation range, and finally reached 0.71. From the point of view of
order flow, the bears did not place too much bet on the market correction, buttechnically, if the Australian dollar falls below yesterday's US trading low of 0.7040, it may be expected to trigger a certain degree of correction in the
short-term. A break of 0.7025 may destroy the short-term upward trend. Let’s look at the key support for the day, which is the starting point of the US
market at 0.6950. The top can pay attention to the stabilization of 0.71 first,
and the successful breakthrough will first look at 0.7025, and then the startingpoint of the previous heavy volume drop at 0.7150. The resistance is slightly
stronger, and the mid-line target is 0.72-0.7250.
Note: The above strategy was updated at 16:00 on August 11. This strategy is a day strategy, please pay attention to the release time of the strategy.
SEVEN · Technical Level ·USD/JPY(No order flow data yet)
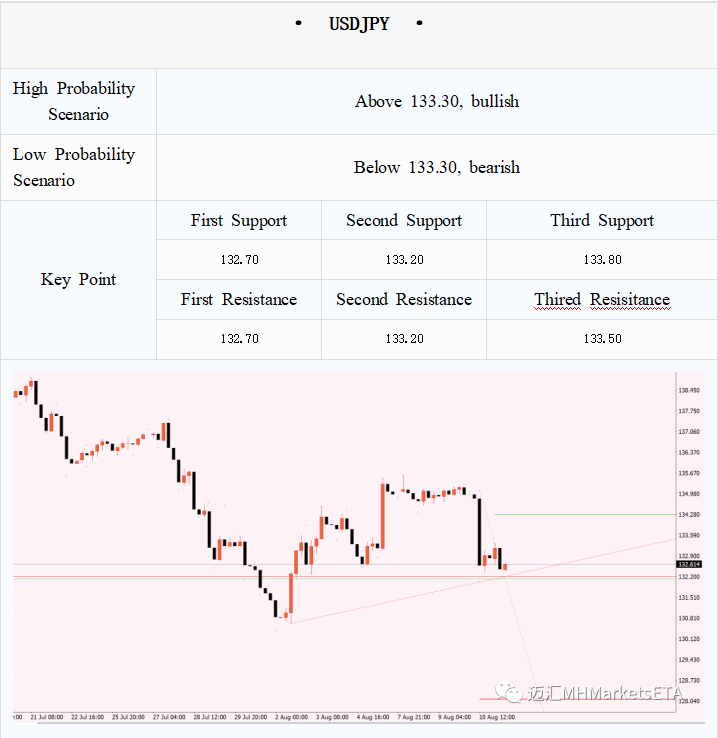
Technical Analysis
The USD/JPY pair extended its recovery period and managed to hold
above the key hurdle at 133.00 during the Asian session. After plunging close to 132.00 on Wednesday, the asset pushed its pullback to 132.00. A further
journey may still be crucial as more upside requires enough strength from USD bulls.
The asset turned negative after the U.S. consumer price index (CPI) fell
to 8.5% from 9.1% previously. Price pressures showed signs of exhaustion
after the Federal Reserve (Fed) remained a headache, to the delight of market participants. Meanwhile, the U.S. Dollar Index (DXY) is facing a surge of enthusiasm from market participants.
Note: The above strategy was updated at 16:00 on August 11. This strategy is a day strategy, please pay attention to the release time of the strategy.
Statement | Disclaimer
Disclaimer: The information contained in this material is for general advice only. It does not take into account your investment goals, financial situation or special needs. Mohicans Markets has made every effort to ensure the accuracy of the information as of the date of publication. Mohicans Markets makes no warranties or representations regarding this material. The examples in this material are for illustration only. To the extent permitted by law, Mohicans Markets and its employees shall not be liable for any loss or damage arising in any way, including negligence, from any information provided or omitted from this material.The features of Mohicans Markets products, including applicable fees and charges, are outlined in the product disclosure statements available on the Mohicans Markets website and should be considered before deciding to deal with these products. Derivatives can be risky and losses can exceed your initial payment. Mohicans Markets recommends that you seek independent advice.
MohicansMarkets, (Abbreviation: MHMarkets or MHM, Chinese name: Mai hui), Australian Financial Services License No. 001296777.