
MHMarkets:CPI Data Released Tonight

KEY DATA
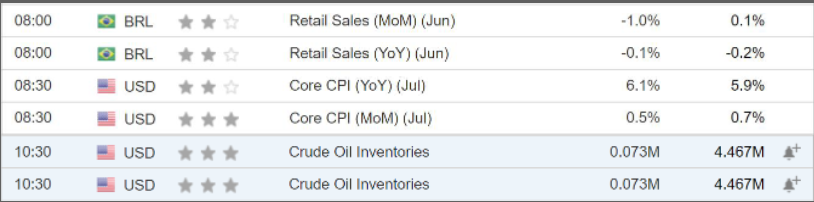
Fundamentals Overview
On Wednesday (August 10), during the Asia-Europe period, spot gold fluctuated and weakened. It is currently trading at US$1,788.06 per ounce. Investors are generally concerned about the performance of the US CPI data in July, although the market expects that the US July CPI year-on-year increase will increase from June. In addition, the market expects that the core CPI, which the Fed is concerned about, will increase from 5.9% in June to 6.1% year-on-year, which increases the Fed’s expectation of a 75 basis point rate hike in September, providing support to the dollar and U.S. bond yields, putting pressure on gold prices.
However, it needs to be reminded that after the release of the Federal Reserve’s CPI data for many times in the past, although the price of gold was under short-term pressure in the intraday, it finally recorded an increase in the end of the day, because high inflation will also attract investors to gold to resist inflation. Investors need to watch out for similar situations.
Investors also need to pay attention to the speeches of Chicago Fed President Evans and Minneapolis Fed President Kashkari on this trading day. At present, market expectations are more likely to be hawkish, which may drag down the performance of gold prices in the short term.
The Mohicans Markets strategy is for reference only and not as investment advice. Please read the terms of the statement at the end of the article carefully. The following strategy was updated at 16:30 on August 10, 2022, Beijing time.
Technical Point of View
ONE · Techinical Level · International Gold
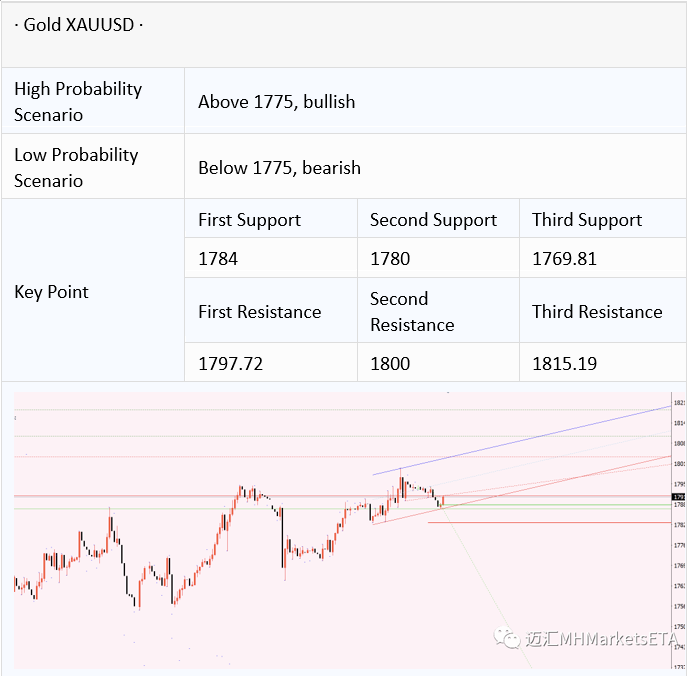
1814-1815 Strong resistance
1800-1805 Asian-European resistance
1789-1790 Asian-European plate support
1784 day low yesterday, weak support
1780 Strong support during the week
1769.8-1771 Key bits
1765 Critical Support
Technical Analysis
Tonight's CPI data is about to be released, and the market is in a
wait-and-see mood, with long and short bets above and below the spot gold
price. The distance between the strong support 1780 and the strong resistance
1814 is relatively far, and the room for intraday shocks will be too large. In
addition, the fluctuation of gold prices may increase after the release of
CPl data, so investors should pay attention to managing risks during the day.
Specifically, there were heavy volume rises and falls near 1800 in the US
market on Tuesday, which may have triggered the exit criteria for certain
positions, resulting in a large short-term correction in the gold price. Gold
continued to fall slightly in the Asian session on Wednesday, and funds may
enter the market at an opportune time after the announcement of CP1, and
you can pay attention to the performance near important supports.
Note: The above strategy was updated at 16:00 on August 10th. This strategy is a day strategy, please pay attention to the release time of the strategy.
TWO · Technical Level · Spot Silver
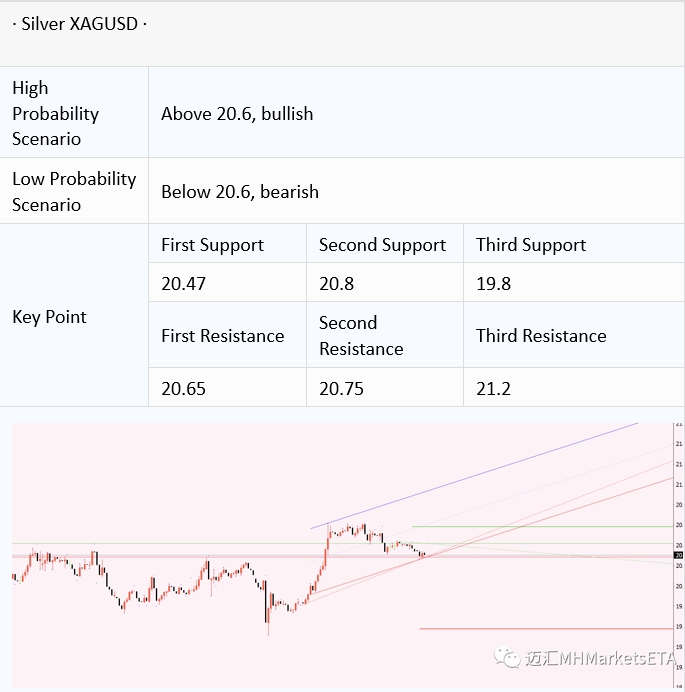
21 The bullishness decreases but the stock is large, the bearishness
increases, the bullish target and weak resistance
20.75Bullish slightly reduced, bearish increased, resistance at 20.6
Bullish increase, bearish increase, divide between long and short
20.47 slightly less bullish, slightly less bearish, short target and weak
support 20.2 second support 19.8 week support
Technical Analysis
Silver began to rise weakly on Tuesday, coupled with the wait-and-see
mood of gold, if gold does not have a good short-term upward momentum
before the CPI data is released tonight, it will be difficult for silver to rise
alone.The volume of silver trading was not high on Tuesday, which also
shows that the wait-and-see mood of silver is not small.
On Tuesday, the US market showed an over-volume signal at 20.7, rising
first and then falling, suggesting that silver may have triggered an exit signal here. At noon on Wednesday, silver has fallen to near the 20.4 support and you can pay attention to the support here and near 20.2.
Note: The above strategy was updated at 16:00 on August 10th. This strategy is a day strategy, please pay attention to the release time of the strategy.
THREE · Technical Level · US Crude Oil
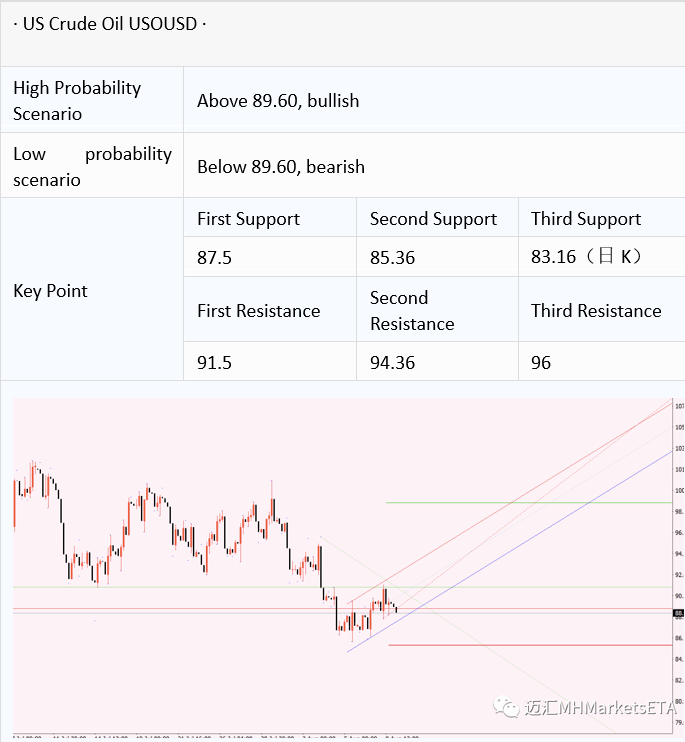
95-96 The bullishness decreases but there is stock, the bearishness
decreases, and the intraday rebound target is the limit. 94 The
bullishness increases, the bearishness decreases slightly, and the rebound target is also the resistance. , the short-term short-term target is 86.5-87.5, the bullish is slightly reduced, the bearish is greatly reduced, the
support level
85 A small increase in bullishness, a substantial increase in bearishness,
bearish target
82-83 support range
Technical Analysis
Crude oil once approached on Tuesday but failed to break through the
strong resistance of 92.8 mentioned yesterday, and then fell back to
around 90, and finally the daily line closed with a doji. Combining
options, the newly added bets have long and short differences around
90, and the range is mainly 87-93, which continues to reflect the
market’s tendency to fluctuate in a range. The top should pay attention to the performance of the 91 resistance oil price again. It is still
expected to test the strong resistance of the 92.8 rebound, and then the short-term attention can be paid to 94, while 95-96.5 is a relatively
extreme rebound level and is also a mid-line resistance area. The
following focuses on the 87.5 support performance, and the 89.5 short
bean line has a certain supporting role during the period. The bearish
target remains 85.
Note: The above strategy was updated at 16:00 on August 10th. This
strategy is a day strategy, please pay attention to the release time of
the strategy.
FOUR · Technical Level · EURUSD
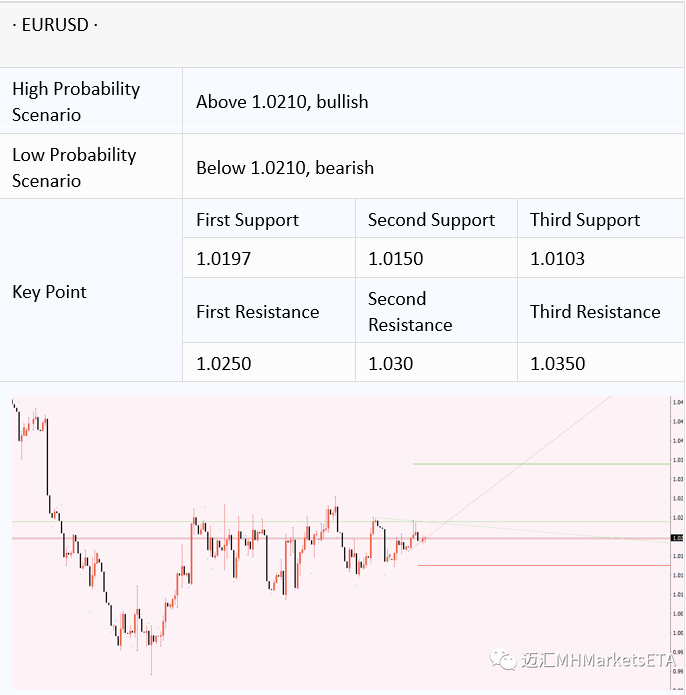
1.0350-1.04 bullish increase, bearish decrease, bullish target area 1.03
bullish increase, bearish decrease, bullish target 1.0250 bullish decrease, bearish decrease but there is stock, resistance level 1.02 bullish slightly increased, bearish increase greatly, key level, breakout focus on the nextaction can 1.0150 bullish unchanged, bearish increase, bearish target
1.01 bullish decrease, bearish increase, bearish target
Technical Analysis
On Tuesday, after the EUR/USD broke through the 1.02 resistance
level, it fell back to the 1.02 area after two rounds of testing the 1.0250 long target, and is still in a narrow range around this
position. Judging from the changes in market order flow, 1.02 has added a large number of bearish bets, which continue to constitute a key intraday level. If it falls below this level, you need to pay attention to the downward momentum of Europe and the United
States, and the short target is 1.0150 and 1.01. On the other hand,
above 1.02, continue to focus on the resistance level formed by
1.0250, where the bullish and bearish exits are synchronized,
indicating that both bulls and bears are no longer optimistic about
the possibility of a retest of this level. However, if it unexpectedlybreaks through 1.0250, the bullish target will be 1.03. There are
also bullish bets at 1.0350-1.04. If the CPI data shows signs of
falling tonight, it does not rule out the possibility that Europe and the United States will test this range upwards in the future.
Note: The above strategy was updated at 16:00 on August 10th.
This strategy is a day strategy, please pay attention to the release
time of the strategy.
FIVE · Technical Level · GBPUSD
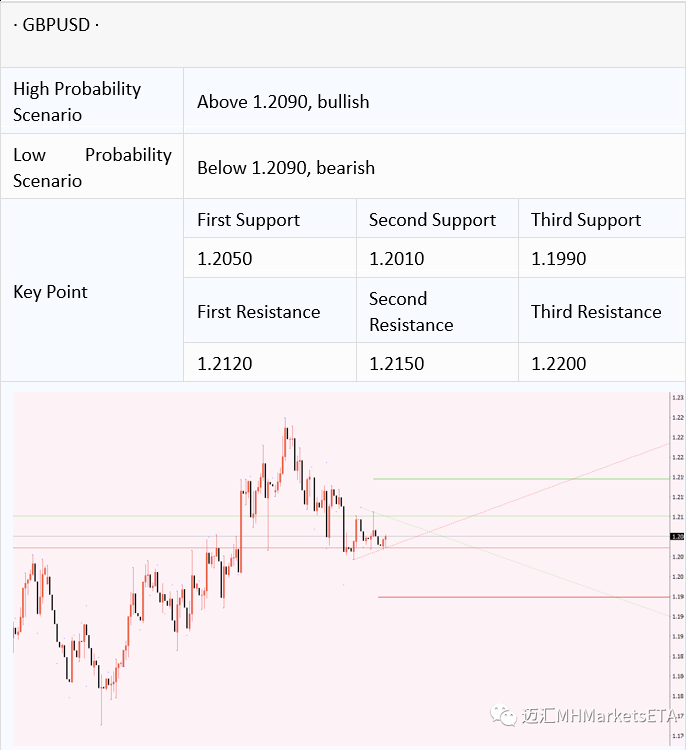
1.22-1.2220 bullish increase, bearish increase, resistance zone
1.2150 bullish increase, bearish increase,
Resistance 1.21-1.2120 bullish increase, bearish increase sharply, resistance area 1.2050 bullish increase, bearish unchanged, support 1.20-1.2020
bullish increase sharply, bearish increase, key support area
Technical Analysis
On Tuesday, the pound against the dollar remained within a narrow range
between 1.2070-1.2130. The two rounds of testing 1.2130 failed to break
through, and it has now fallen back to fluctuate around 1.2070.
From the perspective of options changes, both bullish and bearish options for the pound have more positive bets. The bulls and bears above the current
exchange rate are confronted at 1.21-1.2120, 1.2150, and 1.22, respectively,
which are expected to constitute heavy resistance to the upward movement of
the pound and the United States.
On the other hand, 1.2050, 1.2020, and 1.20 all have more than 100 lots of bullish positions, which is expected to provide good support, but if it
breaks below 1,20, you need to be alert to the rising bearish pressure,
and the short target is 1.1950. 1.1920
Note: The above strategy was updated at 16:00 on August 10th. This strategy is a day strategy, please pay attention to the release time of the strategy.
SIX · Technical Level · AUDUSD
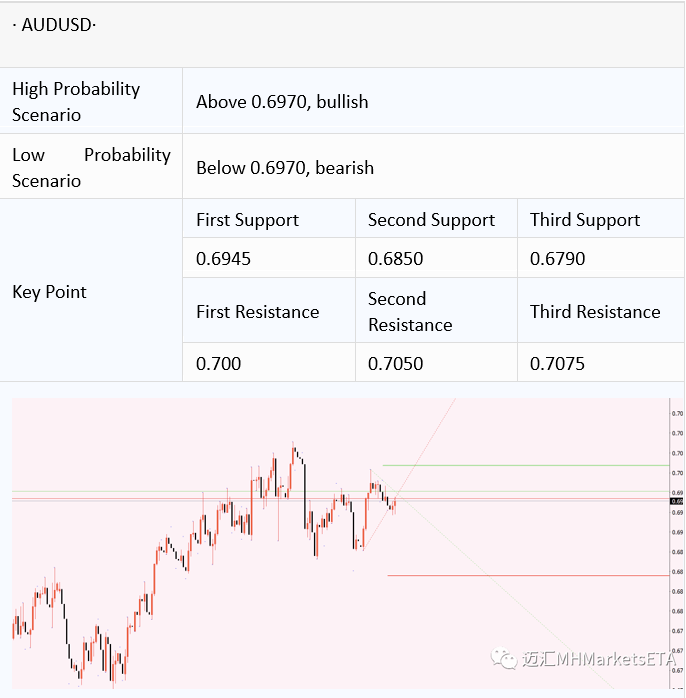
0.7075-0.71 bullish increase, bearish unchanged, upper target
0.7050 bullish increase significantly, bearish unchanged, the upper target 0.70 bullish increase greatly, bearish unchanged, the upper target 0.6950 bullish slightly increase, bearish increase greatly, the first callback target 0.69 bullish slightly decrease, bearish increase, low target 0.6850-0.6875 Bullish unchanged, bearish increase, key support 0.68-0.6825 bullish
unchanged, bearish increase, low target
Technical Analysis
The Australian dollar's volatility range narrowed on Tuesday, maintaininga range of 0.6950-0.70. From the perspective of options and order flow,
the situation of long-short differences has not improved. At the same
time, there are obvious signs of institutional hedging, and long and shortbets have been added respectively. It is speculated that the funds were
prepared in advance for the US CP data tonight. The Australian dollar
is expected to remain in a narrow range ahead of the data. The bottom support can be 0.6950 first. Below 0.69, continue to pay attention to thegains and losses of the trend key support 0.6850-0.6875. The top
continues to focus on the performance near the 0.70 resistance, and the breakthrough is about to face the daily resistance of 0.7030-0.7050. On a larger scale, the Australian dollar has yet to get out of the
0.6850-0.7050 daily rebound consolidation range.
SEVEN · Technical Level ·USD/JPY(No order flow data yet)
Technical Analysis
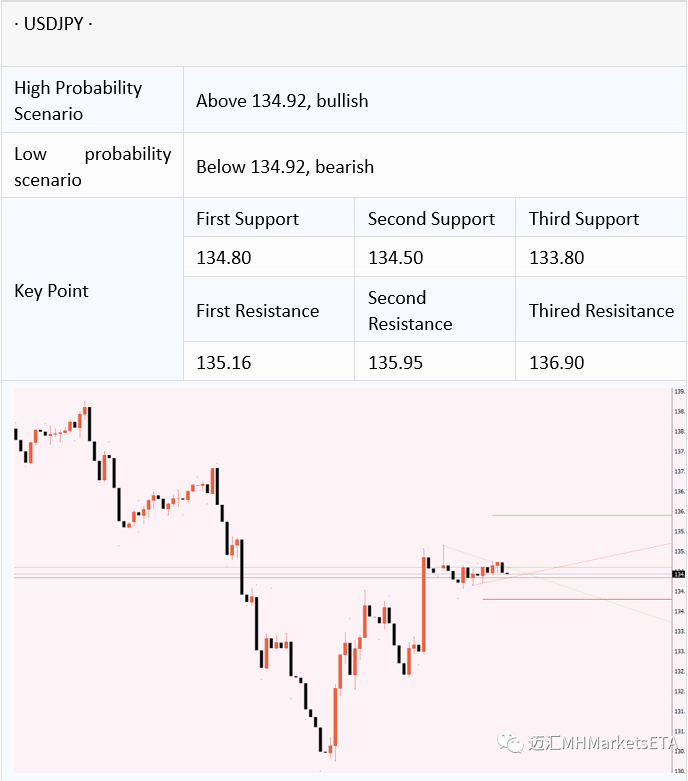
USD/JPY held steady near the 135.00 water level. On Tuesday, Japan
announced that the domestic corporate price index rose 8.6% year-on-year in
July, an increase that exceeded expectations. However, the stimulus effect of
the data on the yen is limited. Expectations of aggressive interest rate hikes bythe Federal Reserve pushed U.S. bond yields higher, providing support as
traders braced for key U.S. CPI data.
On the daily chart, USD/JPY is close to MA20. If it breaks through this
position further, USD/JPY will continue to rebound and move higher. On the
contrary, if it encounters resistance, the yen will continue the previous
correction and go up. The initial resistance above is 135.70, and the support
below is 133.80 and 132.80.
Note: The above strategy was updated at 16:00 on August 10th. This strategy is a day strategy, please pay attention to the release time of the strategy.
Statement | Disclaimer
Disclaimer: The information contained in this material is for general advice only. It does not take into account your investment goals, financial situation or special needs. Mohicans Markets has made every effort to ensure the accuracy of the information as of the date of publication. Mohicans Markets makes no warranties or representations regarding this material. The examples in this material are for illustration only. To the extent permitted by law, Mohicans Markets and its employees shall not be liable for any loss or damage arising in any way, including negligence, from any information provided or omitted from this material.The features of Mohicans Markets products, including applicable fees and charges, are outlined in the product disclosure statements available on the Mohicans Markets website and should be considered before deciding to deal with these products. Derivatives can be risky and losses can exceed your initial payment. Mohicans Markets recommends that you seek independent advice.
MohicansMarkets, (Abbreviation: MHMarkets or MHM, Chinese name: Mai hui), Australian Financial Services License No. 001296777.