
MHMarkets:The Dollar Waits for the U.S. CPI Data in July

Today’s Disk
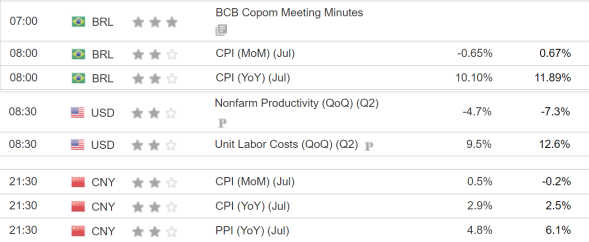
Market Overview
Fundamentals Overview
On Tuesday,August 9, spot gold in the Asian session fell to the pivot point of 1784.50 after hitting the primary resistance. If it can remain above this level, it will confirm bullishness, and the first upward target is 1788.91. Spot silver is currently approaching the first resistance at 20.72 and has fallen back. The first resistance above WTI crude oil concerns 91.47. The U.S. dollar index has repeatedly challenged the pivot point without success. The euro rose against the dollar in the short-term, with the first resistance concerned at 1.0223. GBP/USD fell short-term pivot point, the first support concerns 1.02062.
The Mohicans Markets strategy is for reference only and not as investment advice. Please read the terms of the statement at the end of the article carefully.
The following strategies were updated at 16:30 on August 5, 2022, Beijing time.
Technical Point of View
ONE · Technical Level · International Gold
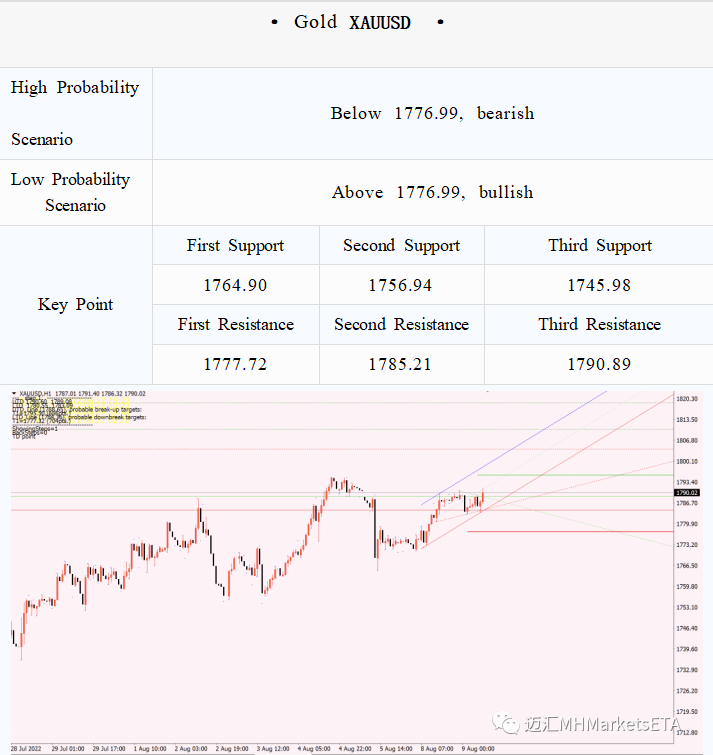
1815-1820 The bullish is slightly reduced but the stock is large, the bearish is slightly reduced, the long target
1805 Bullish increase, bearish increase, first resistance
1795 Bullish decrease but large stock, bearish increase, key resistance level
1790-1785 Bullish decrease, bearish increase and large stock, bearish target and support
1780 short-term support
1769.8-1771 Key bits
1745 The bullish increase slightly, the bearish increase and the stock is large, the second target of the bear
Technical Analysis
As the 10-year U.S. bond yield fell on Monday, risk aversion supported gold prices to rebound again, but the intraday trading volume did not increase
significantly, suggesting that the market is weak on directional bets, and it is
still difficult for bulls to quickly break through the key resistance of 1795.
On the whole, the short bets are mainly concentrated below 1800, and the
bulls did not directly increase their positions at 1770-1825, and the further upward movement can be doubtful.
In the upward direction, there is a divergence between long and short positionsat 1790, which is the first resistance; while the previous high of 1795 has
been leaving the call options in the past few days, which will be the key
resistance; if it can break above, it may look to the long target of 1815-1820,which is a bullish position. The stock of options is the main one. Below the
current price, there are a lot of new put options near 1765-1770, and the
bullish and bearish stocks are large, which will be the short target and supportfor the fall of the gold price; if it falls further, it may be the next short
target 1745.
Note: The above strategy was updated at 16:00 on August 9th. This strategy is a day strategy, please pay attention to the release time of the strategy.
TWO · Technical Level · Spot Silver
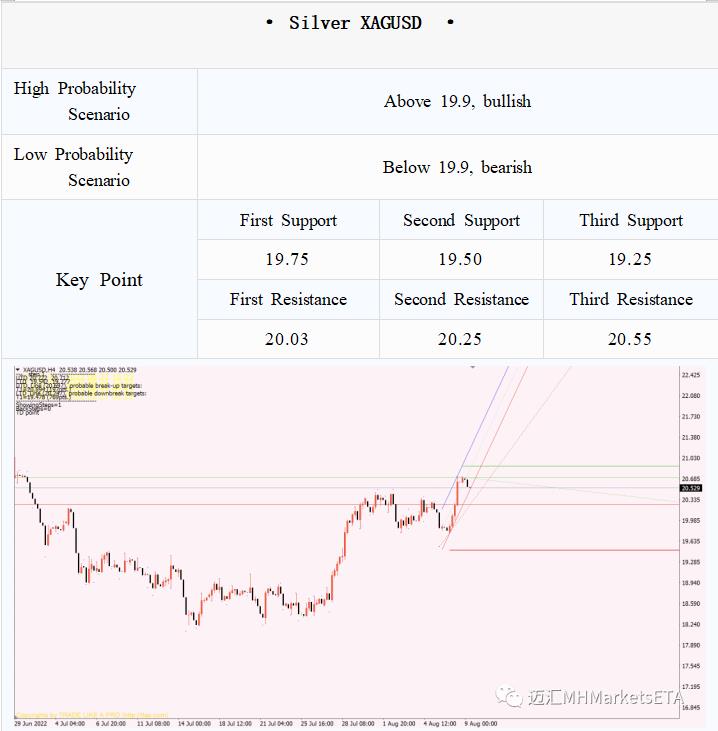
21.5 bullish increase, bearish unchanged, long second target 21 bullish
increase, bearish slightly reduced, bullish target 20.75 bullish
increase, bearish slightly increase, resistance 20.45-20.55 bullish
increase, bearish increase slightly, intraday key support 20.25 bullish
Decrease, bearish increase slightly, support level 20 is bullish
decrease but the stock is large, bearish increase, callback target and
support
Technical Analysis
Spot silver broke out of the consolidation range since August on Monday, and recovered all losses since the breakout on June 30. Both open interest
and trading volume increased, and funds showed a willingness to flow in.
From the perspective of options, the net increase of call options above 20.5 is the main reason, the 20.75 call option + 28 lots, which has become the first short-term resistance, and the 21 stock call options have a significant
advantage, which is the main goal of the bulls in the near future: only
breakthroughs can we look further to 21.5. If the price falls below 20.45, the short-term action will be weakened, of which 20.2-20.25 has strong support,
while the main target of the bears is the 20 mark.
Note: The above strategy was updated at 16:00 on August 9th. This strategy is a day strategy, please pay attention to the release time of the strategy.
THREE · Technical Level · US Crude Oil
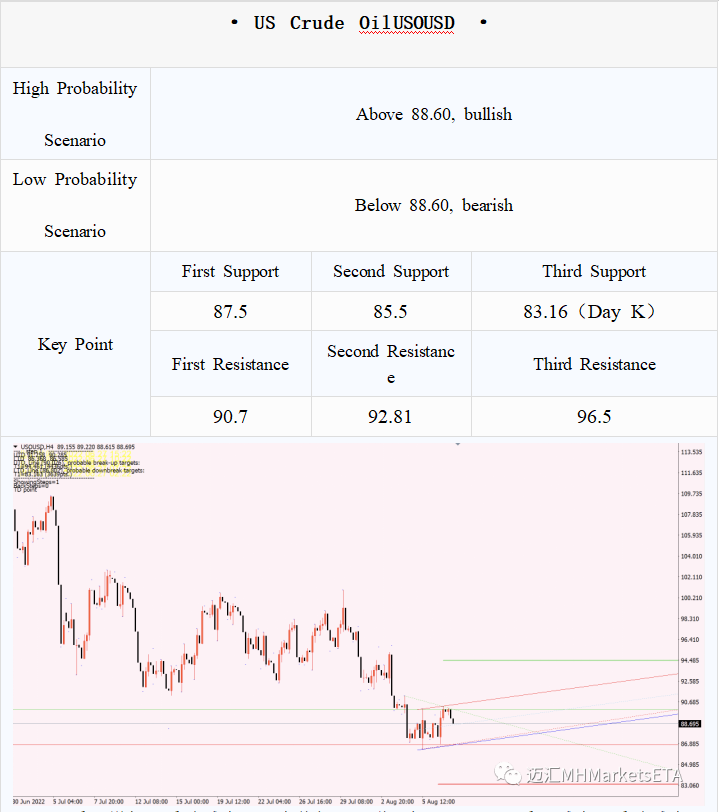
95-96 Bullish increase, bearish decrease, intraday bias towards the
extreme rebound target 993-93.5 Bullish decrease, bearish decrease,
rebound target 91 Bullish increase, bearish decrease, short-term upward
target 90 Bullish slightly increase, bearish decrease greatly, downside
action can be weakened 86.5-87 bullish increase, bearish decrease,
support level 85 bullish slightly increase, bearish increase greatly, bear
target
Technical Analysis
On Monday, US crude oil remained in the low range of 87-90.7 and fluctuated, but the daily line closed close to the bottom type, and there may be a
certain demand for rebound technically. However, from the perspective of
options, the overall wait-and-see mood has become stronger, and no obvious
trend can be seen. . In terms of the midline, under the dual action of long
and short, the risk of selling high and buying low is lower. The top continues to pay attention to the performance of the 90.7 resistance oil price. Standing firm may test the strong resistance of the 92.8 rebound. And below 87.5
enters the support-intensive area, the intraday volatility may weaken, and the
operation is more difficult. The short target below is still 85, and then 80.
During the period, the 82-83 short bean line may play a certain buffering role.
Note: The above strategy was updated at 16:00 on August 9th. This strategy is a day strategy, please pay attention to the release time of the strategy.
FOUR · Technical Level · EURUSD
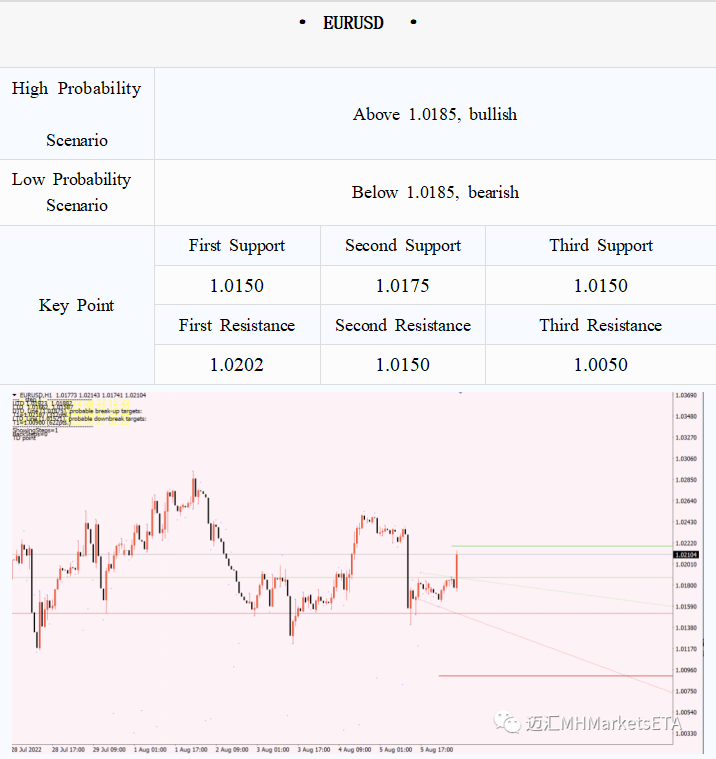
1.04 bullish increase, bearish decrease, bullish target, resistance level
1.0350 bullish increase, bearish unchanged, bullish target 1.03 bullish
increase, bearish decrease, resistance 1.0250 bullish increase, bearish
decrease slightly, bullish target 1.02 bullish increase slightly, bearish
sharply Increase, the key intraday 1.0150 is bullish unchanged, bearish
increase, short target 1.0050-1.01 bullish unchanged, bearish increase,
short target area
Technical Analysis
On Monday, the EUR/USD fluctuated slightly higher, but was capped at 1.0225, and fell back in late trading, currently oscillating below 1.02. From the
perspective of options changes, 598 put options were added in 1.02, which is expected to constitute a strong resistance. Below this level, focus on the
downward momentum of Europe and the United States. The first target is 1.0150, followed by 1.01, 1.0050, and put options in the range of 0.99-1.00 There is a willingness to leave the market, and the possibility of testing parity in
the short term is reduced. On the other hand, if 1.02 is to stand firm again,
then first continue to pay attention to the resistance of 1.0225, and focus on
the long target of 1.0250 and 1.03 after the breakthrough. The top 1.04,
although the level with the most new call options, is less likely to test this
level before the CPI announcement.
Note: The above strategy was updated at 16:00 on August 9th. This strategy is a day strategy, please pay attention to the release time of the strategy.
FIVE · Technical Level · GBPUSD
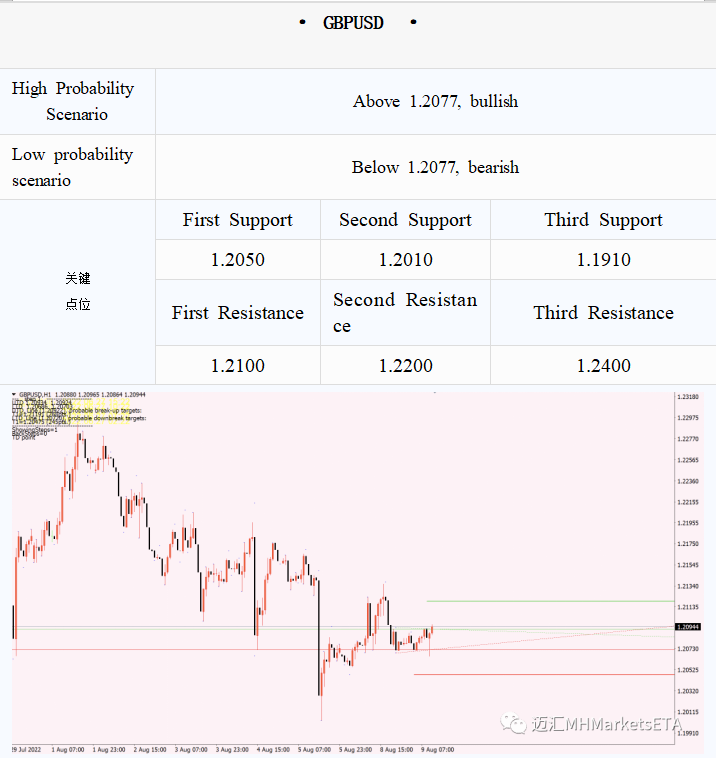
1.2250-1.2270 bullish increase, bearish unchanged, long target zone
1.2220 bullish increase, bearish unchanged, bullish target 1.2150 bullish slightly increased, bearish unchanged but large stock, bullish target, resistance 1.21 bullish decrease, bearish increase, resistance 1.20 bullish slightly decrease, bearish increase, bearish target 1.1970 bullish unchanged, bearish increase, bearish target 1.1950 bullish unchanged, bearish decrease, weakening downward pressure, support
Technical Analysis
On Monday, the pound against the dollar rebounded to 1.2137 in the opening session of the US session, and then fell under pressure, and is currently
trading in a narrow range below 1.21.
From the perspective of options changes, the call options at 1.21 decreased by 7 lots, and the put options increased by 2 lots. It is expected to be the first resistance level in the harvest day. The breakthrough is expected to ease
the short-term downward pressure. The material also constitutes a strong
resistance. On the other hand, under the pressure level of 1.21, the bears
should focus on 1.20, and look at 1.1950-1.1970 below the level, where the
willingness of the bears is different. 1.1920.
SIX · Technical Level · AUDUSD
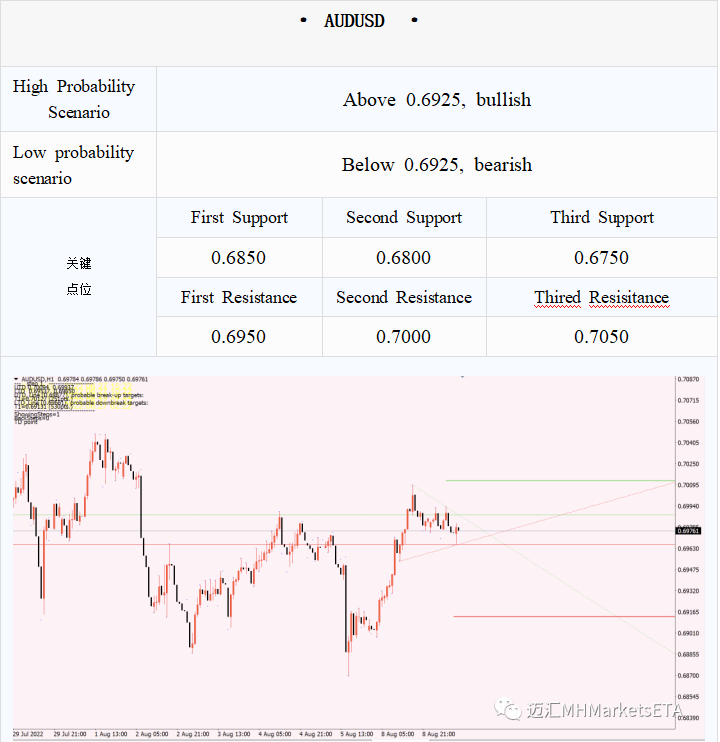
0.7150-0.72 bullish increase, bearish unchanged, midline resistance 0.7075-0.71 bullish increase, bearish unchanged, upper target 0.7050 bullish
increase, bearish unchanged, upper target 0.70 bullish and bearish have
increased slightly, long and short confrontation focus 0.69 bullish
Unchanged, bearish increase, callback target 0.6850-0.6875 bullish
unchanged, bearish increase, lower target is also the key support 0.68-0.6825 bullish unchanged, bearish increase, lower target
Technical Analysis
The Australian dollar rebounded strongly from 0.69 on Monday, touching
above 0.70 at one point, but failed to stabilize. From the perspective of
options, the situation of long and short differences still exists, continue to pay
attention to the performance near the 0.70 resistance during the day, and the
breakthrough is about to face the daily resistance of 0.7030-0.7050. For a
larger level,the Australian dollar is still out of the 0.6850-0.7050 daily rebound
consolidation range. For the lower support, you can first pay attention to 0.6950. Below 0.69, continue to pay attention to the gains and losses of the key
trend support of 0.6850-0.6875.
Note: The above strategy was updated at 16:00 on August 9th. This strategy is a day strategy, please pay attention to the release time of the strategy.
SEVEN · Technical Level ·USD/JPY(No order flow data yet)
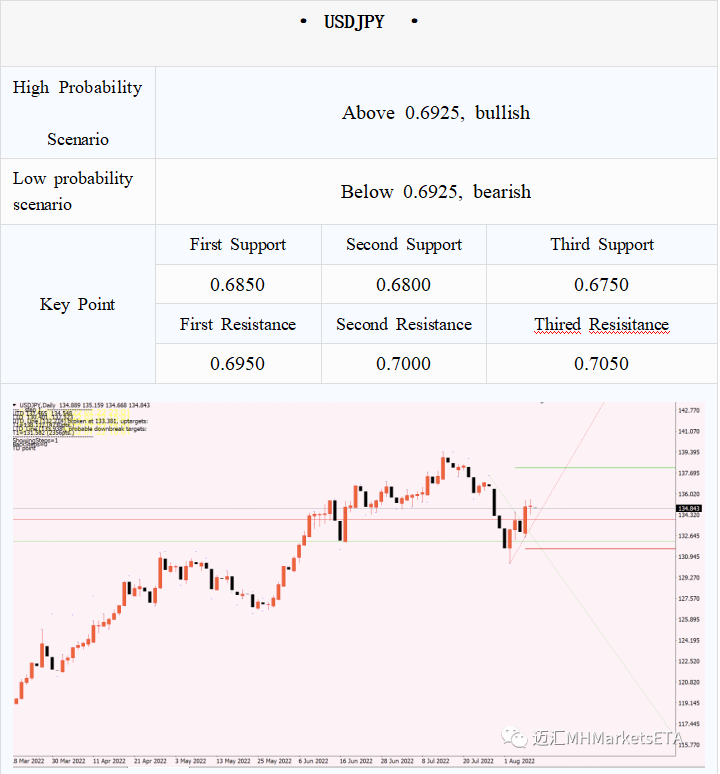
Resistance reference: 135.59, 135.75-135.79, 136.70, 137.47, 134.91-134.99, 138.88
Support reference: 134.85, 134.42-134.32, 132.85, 131.34, 131.17, 130.71
Technical Analysis
In the short term: the United States and Japan closed the bullish "Yang Bao Yin" daily line on Friday, successfully breaking through the 13-day average
line resistance of the downward trend line, and the 38.2% retracement level
since the decline in July-August, returning to 200 days above the average. Thissuggests that the USDJPY may well have formed a key low early last week. The first resistance is at 135.59. After the breakthrough, the next resistance is at 135.75-135.79. Above it is 136.70. If it continues to rise, it is the strong
resistance at 137.47-137.64, which is the high point in July. Strong resistance and start a potential downtrend. Only a close below 134.32-134.42 can break
the near-term upside momentum. But a close below Friday's bullish outside
daily low of 132.52 would be needed for the USDJPY to turn lower.
In the medium term:
Neutral on the US-Japan trend in the next 3-6 months. The first resistance is at 135.59, followed by 137.46-134.47, and the near-term support is at 132.52.
Note: The above strategy was updated at 16:00 on August 9th. This strategy is a day strategy, please pay attention to the release time of the strategy.
Statement | Disclaimer
Disclaimer: The information contained in this material is for general advice only. It does not take into account your investment goals, financial situation or special needs. Mohicans Markets has made every effort to ensure the accuracy of the information as of the date of publication. Mohicans Markets makes no warranties or representations regarding this material. The examples in this material are for illustration only. To the extent permitted by law, Mohicans Markets and its employees shall not be liable for any loss or damage arising in any way, including negligence, from any information provided or omitted from this material.The features of Mohicans Markets products, including applicable fees and charges, are outlined in the product disclosure statements available on the Mohicans Markets website and should be considered before deciding to deal with these products. Derivatives can be risky and losses can exceed your initial payment. Mohicans Markets recommends that you seek independent advice.
MohicansMarkets, (Abbreviation: MHMarkets or MHM, Chinese name: Mai hui), Australian Financial Services License No. 001296777.