
 交易书籍,敬请期待
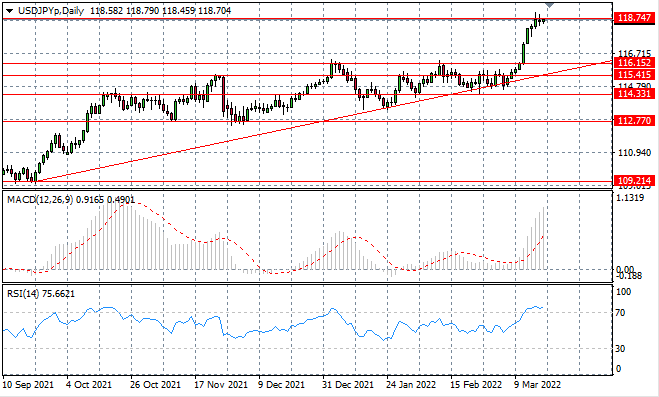
USD/JPY
The USDJPY pair has stalled at the 118.74 resistance line, as a series of doji candles indicate waning bullish momentum. Selling pressure has already begun to rise, therefore we may anticipate a change in near-term price direction.
USDJPY停滞在 118.74 阻力线,一系列十字星蜡烛表明看涨势头减弱。卖压已经开始上升,因此预计近期价格方向可能会发生变化。
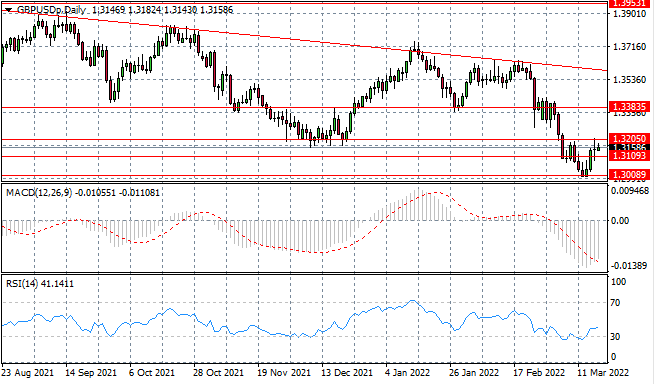
GBP/USD
The GBPUSD pair has rebounded from the 1.300 price floor, breaking the 1.310 resistance line. However, a pullback occurred at the 1.320 resistance level with a doji candle indicating indecision for the pair. Momentum indicators are undergoing reversals.
GBPUSD已从 1.300 价格下限反弹,突破 1.310 阻力线。 然而,在 1.320 阻力位出现回调,十字星蜡烛表示着该货币对犹豫不决。 动量指标正在逆转。
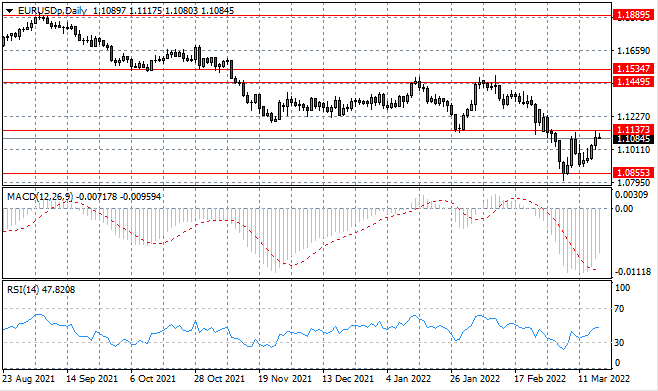
EURUSD
The EURUSD is climbing back towards the 1.113 resistance line as buyers attempt to form a rally. Given the rise in selling pressure, the pair may struggle to drive a break of the resistance area. The price line represents the lower bound of a previous consolidation channel. Momentum indicators are bullish with moderate upward trajectories.
随着买方试图形成反弹,EURUSD正在回升至 1.113 阻力线。 鉴于抛售压力上升,该货币对可能难以突破阻力区。价格线代表先前盘整通道的下限。动量指标看涨,上行轨迹温和。
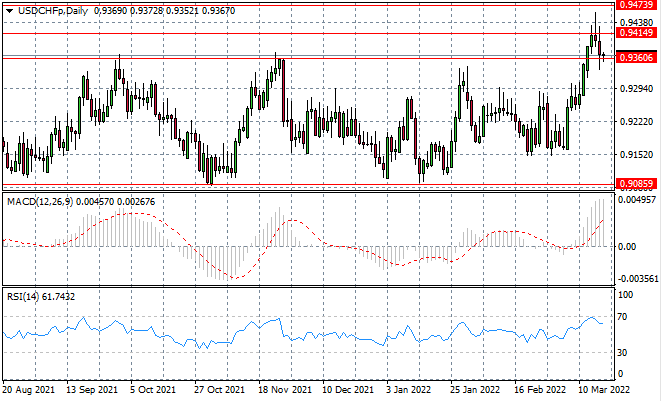
USDCHF
The USDCHF has failed at the 0.941 resistance line, as the pair has now pulled back to the 0.936 support level. The reversal may take price action back, once again, to the 0.908 and 0.936 trading range. Momentum indicators are undergoing reversals.
USDCHF在 0.941 阻力线失败,该货币对现已回落至 0.936 支撑位。 反转可能使价格再次回到 0.908 和 0.936 的交易区间。动量指标正在逆转。
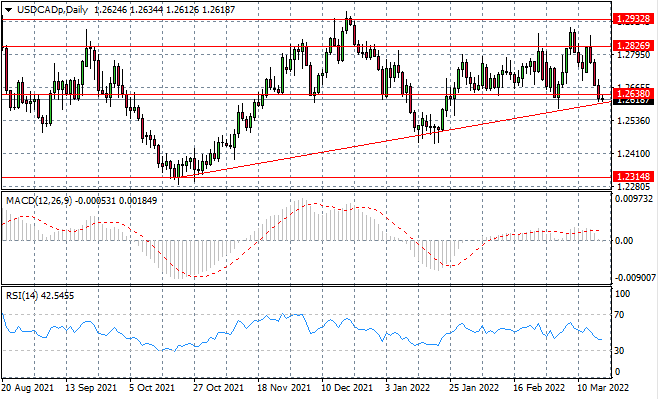
USDCAD
The USDCAD has pulled back to the ascending trendline, which has been a key support level for the pair since October 2021. A break of the 1.263 support level is significant given that it has held on several previous occasions. Momentum indicators have flattened in neutral/bearish territory.
USDCAD已回落至上升趨勢線,這是從 2021 年 10 月以來該貨幣對的關鍵支撐位。鑑於此前曾多次守住 1.263 支撐位,因此突破該支撐位意義重大。動量指標在中性/看跌區域趨於平緩。
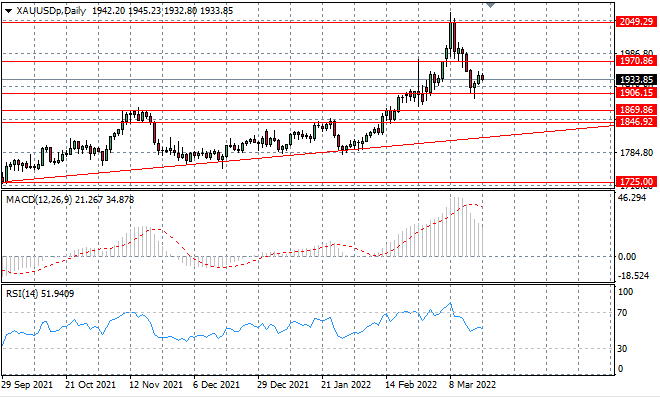
XAUUSD
The XAUUSD is starting to climb away from the 1906 support level as buying pressure begins to rise. The current trading session signals how long the bullish conviction is as seller return mid-rally and mid-range. The metal will likely oscillate within the current trading range going forward.
隨著買盤壓力開始上升,XAUUSD 開始從 1906 的支撐位攀升。 當前的交易時段表示著,隨著賣方返回區間中部,看漲信念持續多長時間。 未來該金屬可能會在當前交易區間內震盪。
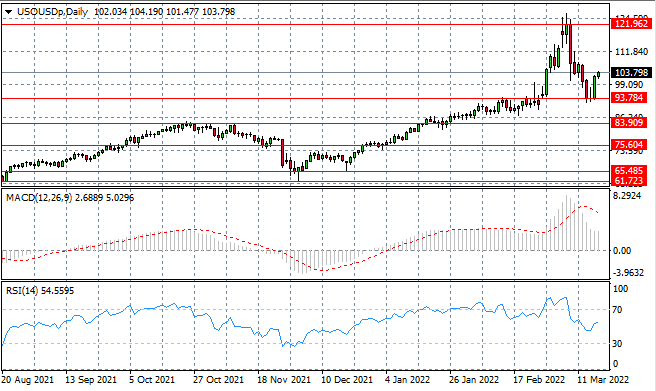
USOUSD
The USOUSD has surged back towards the $100 per barrel range, as price action bounced off the 93.78 support line as the sell-off came to an end. Geopolitical factors will continue to impact the commodity going forward. Momentum indicators have stalled in bullish territory.
隨著拋售結束,價格走勢從 93.78 支撐線反彈,USOUSD 已回升至每桶 100 美元的區間。 地緣政治因素將繼續影響大宗商品的未來發展。動量指標停滯在看漲區域。
In the event of any discrepancies between the Chinese version and English version of the Daily Insights, the latter shall prevail.
以上文章中英文版本若有任何歧義,概以英文版本為準。
This article is to be used only as a reference, not as a basis for trading.
策略仅供参考 不做交易依据
Copyright © 2024 UK UNITED PUHUI TECHNOLOGY CO., LTD,企业编号:11097854
