
 交易书籍,敬请期待
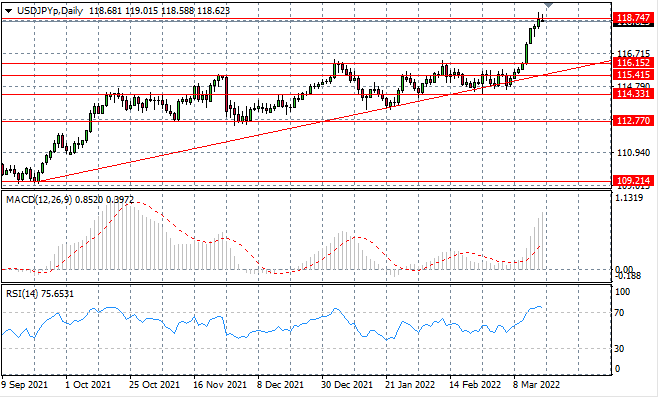
USD/JPY
The USDJPY pair appears to be stalling after bullish momentum started to lose steam. A rise in selling pressure indicates that a reversal may be on the cards as bearish sentiment appears to be rising. Momentum indicators are bullish although RSI is flattening beyond the overbought zone.
在看涨势头开始失去动力后,USDJPY似乎停滞不前。 抛售压力的上升表示因为看跌情绪似乎正在上升,可能会出现逆转。 动量指标看涨,尽管相对强弱指数(RSI)在超买区域外趋于平缓。
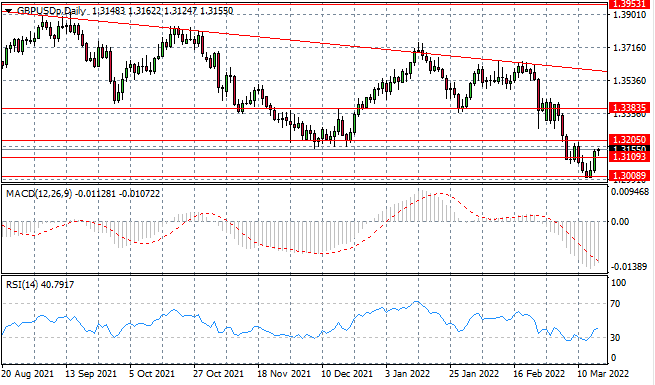
GBP/USD
The GBPUSD pair has rebounded from the 1.300 price floor, breaking the 1.310 resistance line. Currently conviction should be sufficient to sustain the rally and return the pair to the previous trading range. Momentum indicators are bearish and undergoing reversals.
GBPUSD已从 1.300 价格下限反弹,突破 1.310 阻力线。目前的信念应该足以维持涨势并使该货币对回到之前的交易区间。动量指标看跌并正在逆转。
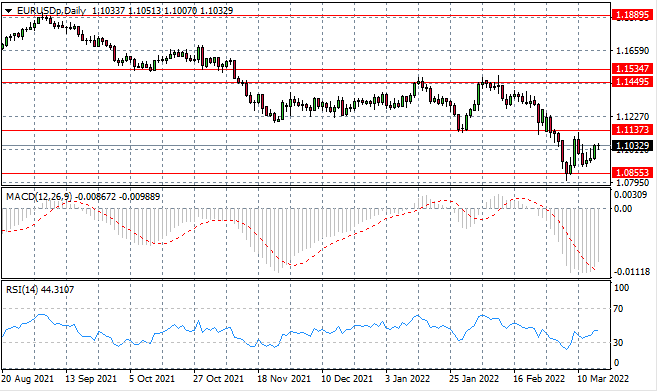
EURUSD
The EURUSD is climbing back towards the 1.113 resistance line albeit with moderate conviction. The price line represents the lower bound of a previous consolidation channel. Momentum indicators are bullish with sharp upward trajectories.
EURUSD正在回升至 1.113 阻力线,尽管有一定的信心。价格线代表先前盘整通道的下限。动量指标看涨,轨迹急剧上升。
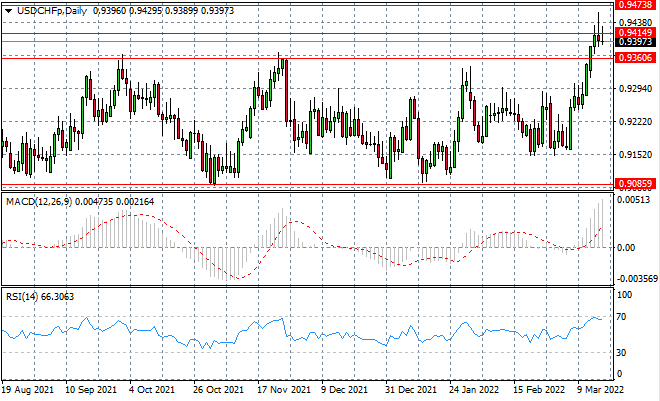
USDCHF
The USDCHF has failed at the 0.941 resistance line, with long upper shadows reflecting the bearish sentiment. A reversal is underway with price action likely headed towards the 0.936 support line. Momentum indicators are testing overbought conditions.
USDCHF未能跌破 0.941 阻力线,较长的上影线反映出看跌情绪。反转正在进行中,价格走势可能朝着 0.936 支撑线前进。动量指标正在测试超买状况。
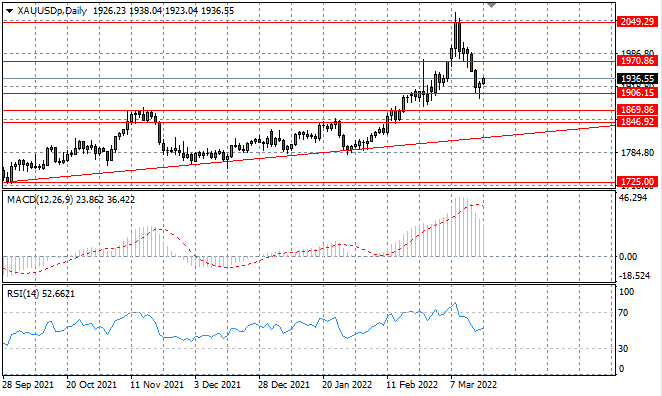
XAUUSD
The XAUUSD is starting to climb away from the 1906 support level as buying pressure begins to rise. Given current conviction levels, momentum may be insufficient to drive the break. Momentum indicators have flattened in bullish territory.
随着买盘压力开始上升,XAUUSD 开始从 1906 的支撑位攀升。鉴于目前的信念水平,动量可能不足以推动突破。动量指标在看涨区域趋于平缓。
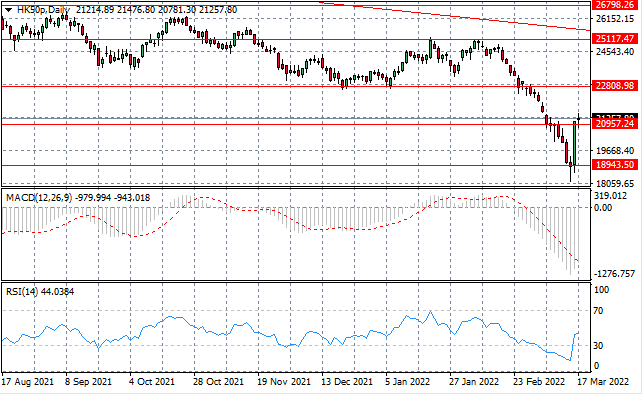
HK50
The HK50 has surged back towards the 20,957 resistance line after hitting multi-year lows. The question is whether buyers have enough support to return to the previous consolidation range between the 22,808 and 25,117 price levels. Momentum indicators have sharp upward trajectories.
HK50 在触及多年低点后已回升至 20,957 阻力线。 重点问题买方是否有足够的支持回到之前的 22,808 和 25,117 价格水平之间的盘整区间。 动量指标有急剧上升的轨迹。
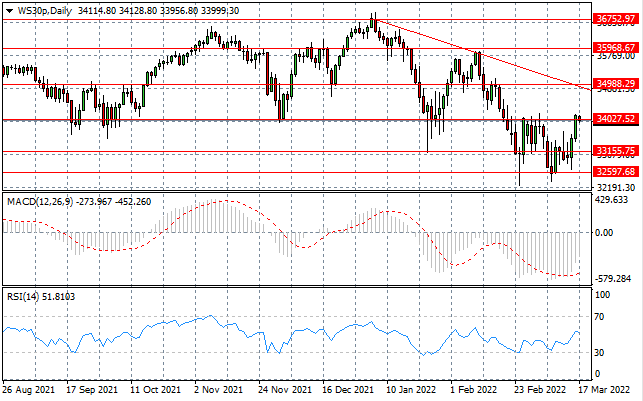
WS30
The WS30 has rebounded from the 32,597 support line yet has stalled when hitting the 34,027 resistance level. Longer-term sentiment is bearish and previous rallies have only reached as far as the descending trendline. Momentum indicators are bullish.
WS30 已从 32,597 支撑线反弹,但在触及 34,027 阻力位时停滞不前。 长期情绪看跌,先前的反弹仅达到下降趋势线。动量指标看涨。
In the event of any discrepancies between the Chinese version and English version of the Daily Insights, the latter shall prevail.
以上文章中英文版本若有任何歧义,概以英文版本为准。
This article is to be used only as a reference, not as a basis for trading.
策略仅供参考 不做交易依据
Copyright © 2024 UK UNITED PUHUI TECHNOLOGY CO., LTD,企业编号:11097854
