
 交易书籍,敬请期待
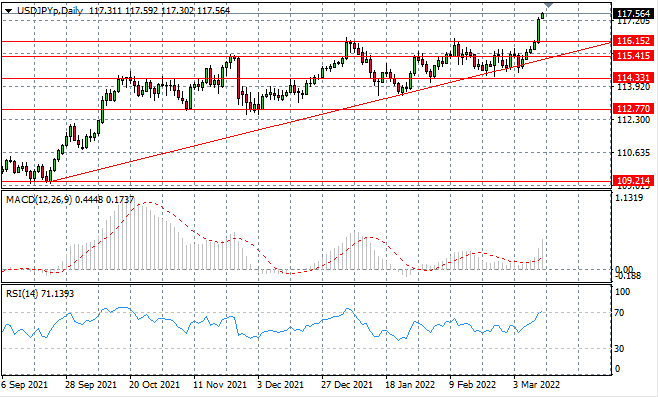
USD/JPY
USDJPY price action has broken out of the trading range which contained rallies since December 2021. A break of the 116.15 price line has been driven by strong bullish candles, indicating considerable support for US Dollar buying. Momentum indicators are bullish although RSI is testing overbought conditions.
从 2021 年 12 月以来,USDJPY的价格走势已突破包含反弹的交易区间。强劲的看涨蜡烛推动 116.15 价格线的突破,表明对美元USD的巨大支持。尽管相对强弱指数(RSI)正在测试超买条件,但动量指标看涨。
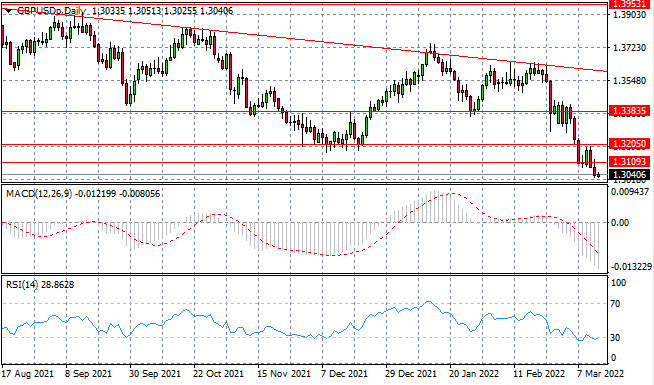
GBP/USD
The GBPUSD pair has finally broken the 1.310 support level after several attempts and a rise in volatility. Bearish sentiment has dominated medium term price action and reflects a longer-term trend. However, momentum indicators suggest that further downside may be limited with RSI bouncing along the 30 support line.
经过几次测试和波动性上升,GBPUSD终于突破 1.310 的支撑位。 看跌情绪主导中期价格走势并反映出长期趋势。 然而,动量指标表明,随着相对强弱指数(RSI) 沿着 30 支撑线反弹,进一步的下行空间可能会受到限制。
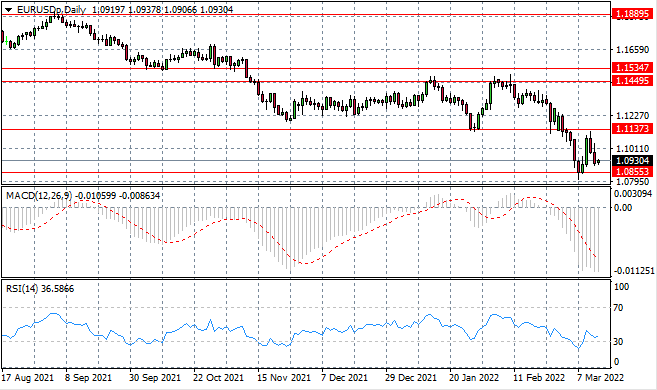
EURUSD
The EURUSD has pulled back, once again, towards the 1.0855 support level as bearish sentiment began to rise in the previous week of trading. Buying activity has begun in the early Asian trading session and a new trading week. Momentum indicators reflect bullish reversal attempts but remain in bearish territory.
由于在前一周的交易中看跌情绪开始上升,EURUSD再次回落至 1.0855 支撑位。买盘活动在亚洲交易时段早盘和新的交易周开始。动量指标反映出看涨的逆转尝试,但仍处于看跌区域。
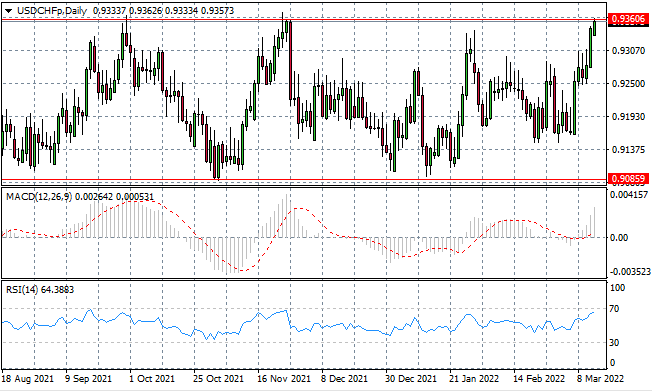
USDCHF
The USDCHF has rocketed towards the 0.9360 resistance line as bullish sentiment has risen sharply in recent trading. The resistance are represents a price ceiling which has contained rallies since September 2021, therefore a break would be significant. Momentum indicators are bullish with RSI approaching the overbought line.
由于近期交易中看涨情绪急剧上升,USDCHF 已飙升至 0.9360 阻力线。 阻力位代表从 2021 年 9 月以来包含反弹的价格上限,因此突破意义重大。动量指标看涨,相对强弱指数(RSI) 接近超买线。
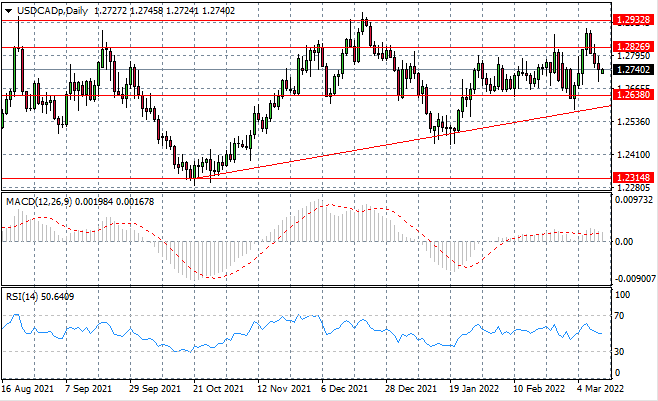
USDCAD
The USDCAD has fallen back further into the previous consolidation channel, yet bearish momentum appears to be stalling. A small-bodied candle to end last week's trading signaled a strong tussle between buyers and sellers. Momentum indicators have downward trajectories yet remain in neutral/bullish territory.
USDCAD已进一步回落至之前的盘整通道,但看跌势头似乎停滞不前。 上周交易结束的小蜡烛表明买卖双方之间的激烈争斗。动量指标呈下行轨迹,但仍处于中性/看涨区域。
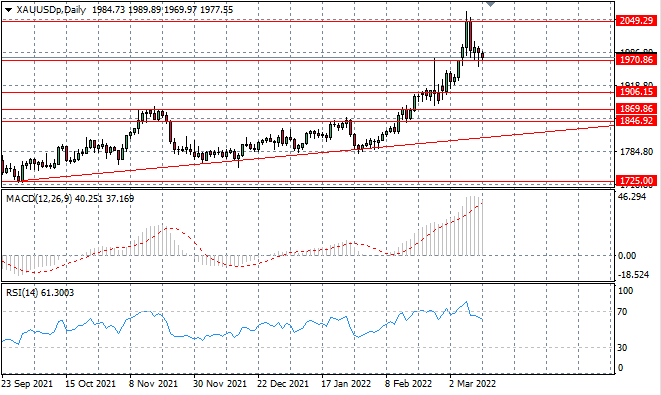
XAUUSD
The XAUUSD continues to test the 1970 support line as as buying pressure begins to rise at this support level. So far, bullish activity has contained a break and therefore the pair may now consolidate at this price level. Momentum indicators are undergoing reversals with downward trajectories.
XAUUSD 继续测试 1970 年的支撑线,因为在该支撑位买盘压力开始上升。 到目前为止,看涨活动已经包含突破,因此该货币对现在可能在这个价格水平上盘整。 动量指标正在以下行轨迹反转。
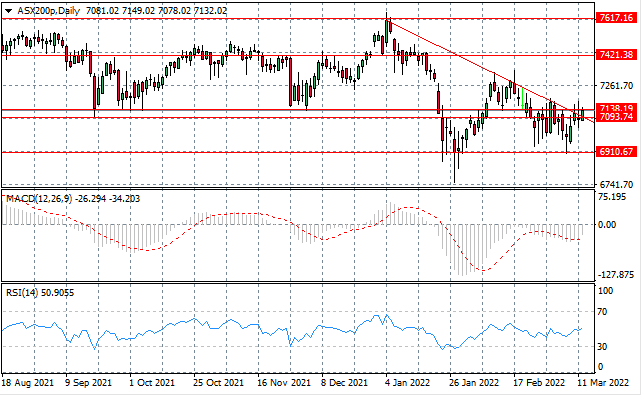
ASX200
The ASX200 has broken the descending trendline and 7093 support line and is now testing the 7138 resistance line, as bullish momentum drives price action. The trendline has contained previous rallies and a break may now take the index back to the previous trading range. Momentum indicators are bullish.
ASX200 已突破下降趋势线和 7093 支撑线,现在正在测试 7138 阻力线,因为看涨势头推动价格走势。 趋势线包含之前的反弹,现在突破可能会使指数回到之前的交易区间。 动量指标看涨。
In the event of any discrepancies between the Chinese version and English version of the Daily Insights, the latter shall prevail.
以上文章中英文版本若有任何歧义,概以英文版本为准。
This article is to be used only as a reference, not as a basis for trading.
策略仅供参考 不做交易依据
Copyright © 2024 UK UNITED PUHUI TECHNOLOGY CO., LTD,企业编号:11097854
