
 交易书籍,敬请期待
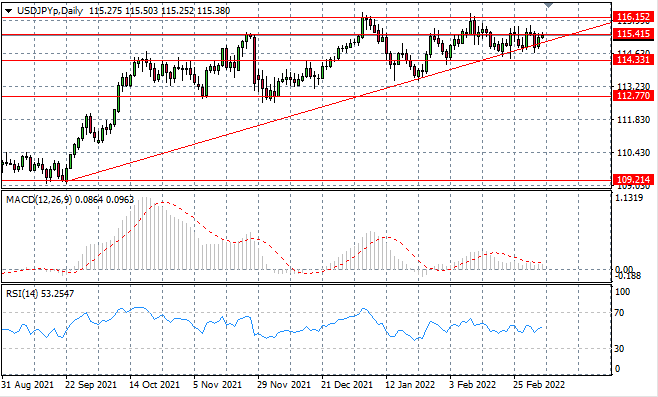
USD/JPY
USDJPY price action is narrowing towards the apex of a cross between the ascending trendline and the 115.41 resistance line. Typically this pattern of price action occurs before a breakout where both buyers appear to have lost steam and may regroup to drive a change in price action.
USDJPY的价格走势正在向上升趋势线和 115.41 阻力线交叉的顶点收窄。通常,这种价格行为模式发生在突破之前,此时两个买方似乎都失去动力,并可能重新组合以推动价格行为的变化。
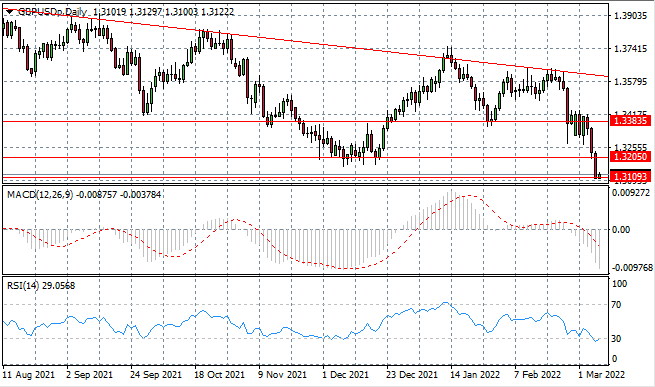
GBP/USD
The GBPUSD pair has plummeted further and is now testing the 1.310 price level where buyers have returned in the early Asian trading session. Momentum indicators suggest that a recovery could be underway as RSI begins a bullish momentum reversal.
GBPUSD进一步下跌,目前正在测试亚洲早盘买家返回的 1.310 价格水平。动量指标表明,随着相对强弱指数(RSI)开始看涨动能逆转,复甦可能正在进行中。
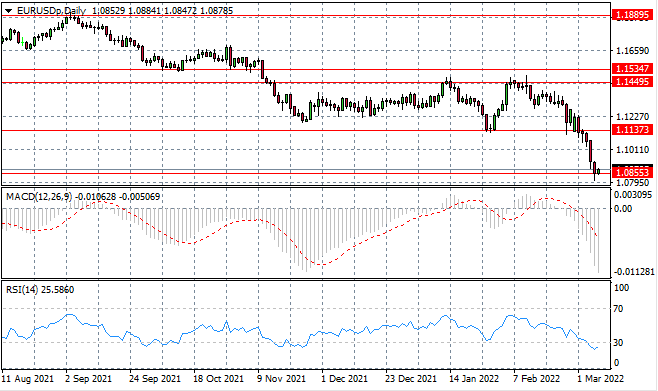
EURUSD
The EURUSD sell-off appears to have stalled at the 1.085 support line as buying pressure has started to rise in the last few trading sessions. A bullish reversal may now be underway as according to momentum indicators, the pair is extremely oversold.
由于过去几个交易日的买盘压力开始上升,EURUSD的抛售似乎停滞在 1.085 支撑线。根据动量指标,现在可能正在出现看涨逆转,该货币对极度超卖。
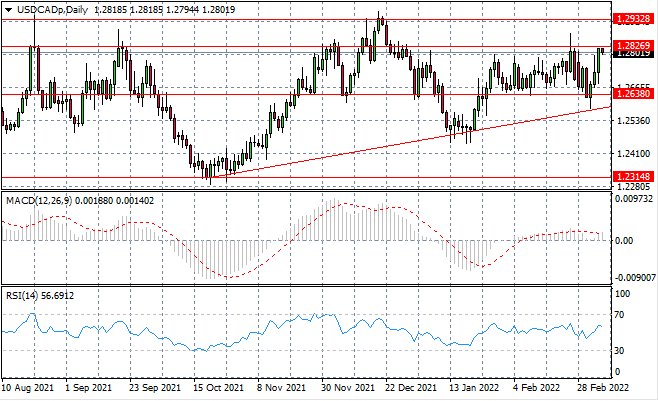
USDCAD
The USDCAD sell-off has taken the pair toward the upper bound of the current consolidation channel. Currently sellers are dominating price action which indicates that a break is unlikely in the near-term. Momentum indicators also reflect the slowdown in bullish sentiment with flattening trajectories in bullish territory.
USDCAD的抛售已将该货币对推向当前盘整通道的上限。目前卖方主导价格走势,这表示短期内不太可能出现突破。动量指标也反映出看涨情绪的放缓,看涨区域的轨迹趋于平缓。
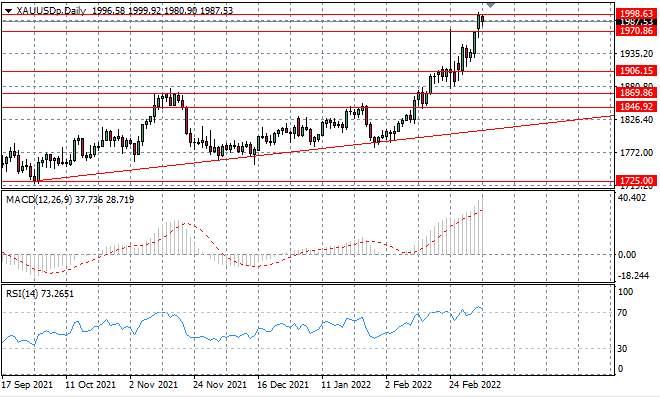
XAUUSD
The XAUUSD rally has been contained at the 1998 price line, as sellers return to the metal albeit with moderate conviction. The next target will be the 1970 support line as a reversal begins to build. Momentum indicators continue to bounce along the overbought line suggest bearish conviction is currently insufficient.
XAUUSD 的涨势已被控制在 1998 的价格线,因为卖方虽然持有温和的信念,但仍会重返该金价。 下一个目标将是 1970 的支撑线,因为反转开始形成。 动量指标继续沿超买线反弹,表明目前看跌信念不足。
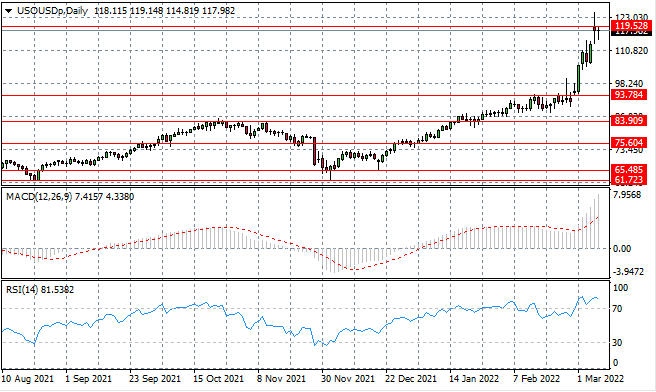
USOUSD
The USOUSD has begun to stall at the 119.52 resistance line, as a long-legged doji indicates a real tussle between buyers and sellers. The next move will be significant and today's trading will determine which side was able to overcome the battle. Momentum indicators suggest the commodity overbought.
USOUSD 已开始在 119.52 阻力线处停滞,因为长腿十字星表示买卖双方之间存在真正的争斗。 代表着下一步行动意义重大,而今天的交易将决定哪一方能够战胜这场战斗。动量指标表明商品超买。
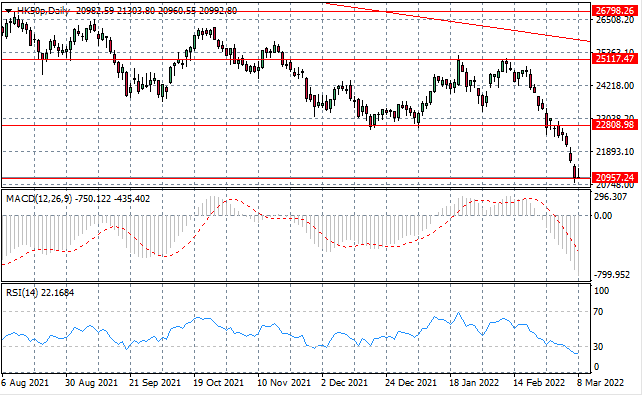
HK50
The HK50 is testing a long-term support level as a reflection of how much the index has sold off in recent trading. The 20,957 price line has not been tested in over 1 year as a marker of how bearish the market is with respect to the HK50. Momentum indicators suggest the index is strongly oversold.
HK50 正在测试长期支撑位,以反映出该指数在近期交易中的抛售程度。 20,957 的价格线已超过 1 年未测试,作为市场对 HK50 看跌程度的标志。动量指标表明该指数严重超卖。
In the event of any discrepancies between the Chinese version and English version of the Daily Insights, the latter shall prevail.
以上文章中英文版本若有任何歧义,概以英文版本为准。
This article is to be used only as a reference, not as a basis for trading.
策略仅供参考 不做交易依据
Copyright © 2024 UK UNITED PUHUI TECHNOLOGY CO., LTD,企业编号:11097854
