
 交易书籍,敬请期待
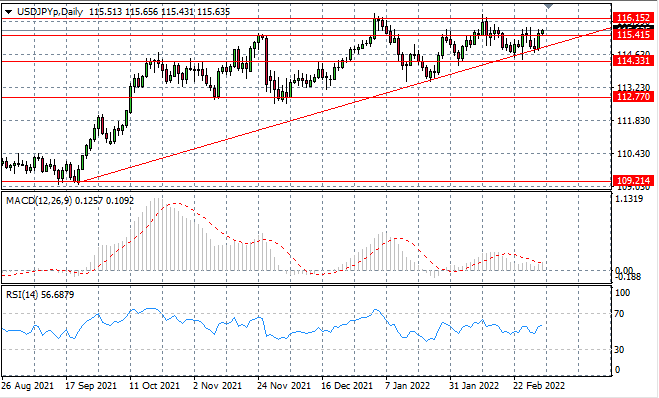
USD/JPY
USDJPY price action has broken the 115.41 resistance line, yet previous breaks have tended to be short-lived. Bullish conviction drove the break in yesterday's session and it remains to be seen whether it an be sustained. Momentum indicators are bullish.
USDJPY价格走势已突破 115.41 阻力线,但之前的突破往往是短暂的。看涨信念推动了昨天交易的突破,它是否能够持续还有待观察。 动量指标看涨。
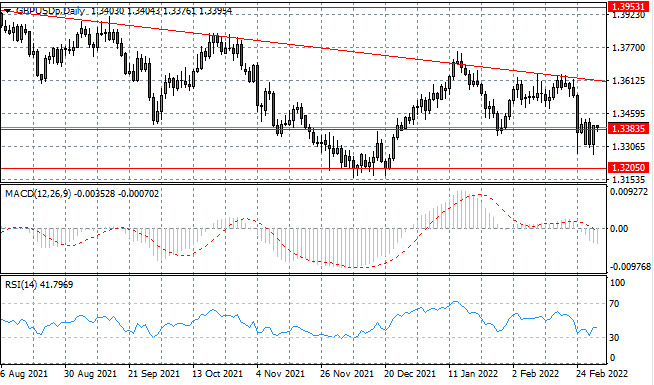
GBP/USD
The GBPUSD pair continues its contest at the 1.338 price line, as neither buyers nor sellers appear to have enough support to drive price action given the uncertainty in fundamentals. Momentum indicators are undergoing recoveries yet remain in bearish territory.
GBPUSD继续在 1.338 价格线上展开竞争,鉴于基本面的不确定性,买卖双方似乎都没有足够的支持来推动价格走势。动量指标正在复苏,但仍处于看跌区域。
EURUSD
The EURUSD sell-off appears to have stalled denoted by a doji in yesterday's trading. The stall may not mean a reversal is on the cards yet, however, further downside does appear limited. Momentum indicators have also decelerated the downward trajectories and RSI is testing oversold conditions.
在昨天的交易中,EURUSD的抛售似乎已经停止,由十字星表示。 停滞不前可能并不意味着逆转即将到来,但进一步的下行空间似乎有限。动量指标也减缓了下行轨迹,相对强弱指数(RSI)正在测试超卖情况。<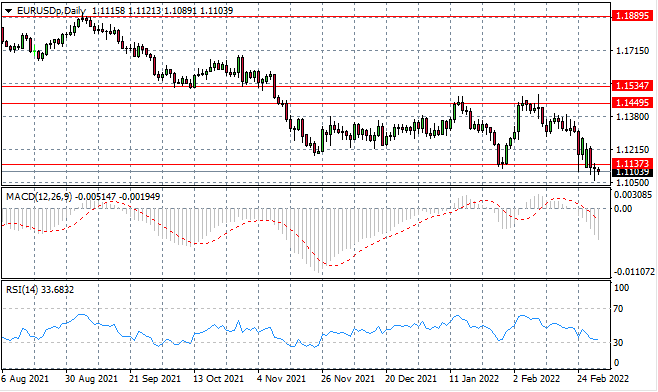
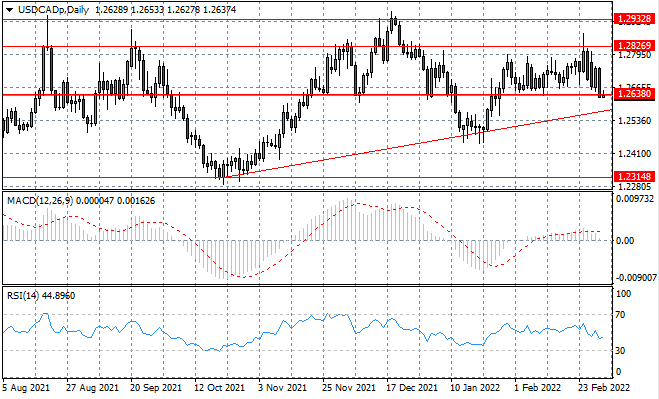
USDCAD
The USDCAD pair has broken the 1.263 support level yet buyers appear determined to contained the break. Each previous test of this support line has resulted in a rebound and the consolidation channel has remained intact. Momentum indicators have downward trajectories.
USDCAD已突破 1.263 支撑位,但买方似乎决心抑制该突破。此前对该支撑线的每次测试都导致反弹,盘整通道保持完好。动量指标有向下的轨迹。
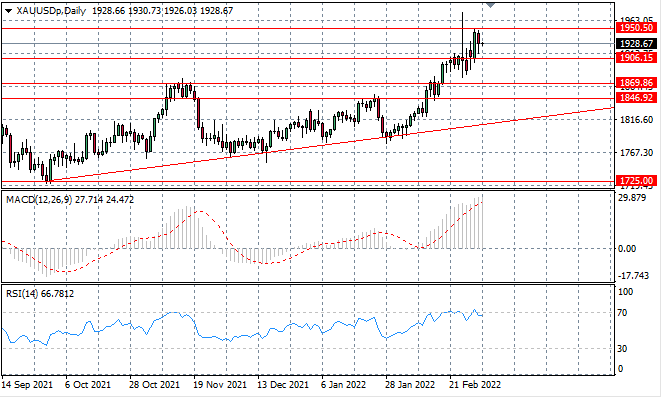
XAUUSD
XAUUSD sellers have returned and the metal may now move back towards the 1906 support line which represented a key resistance line in the previous rally. A break seems unlikely as global markets look to hedge in times of uncertainty. Momentum indicators have flatlined in bullish territory and are floating along the overbought line.
XAUUSD卖方已经回归,金价现在可能会回到 1906 支撑线,该支撑线代表之前反弹中的关键阻力线。由于全球市场在不确定时期寻求对冲,因此似乎不太可能出现突破。动量指标在看涨区域持平,并沿超买线浮动。
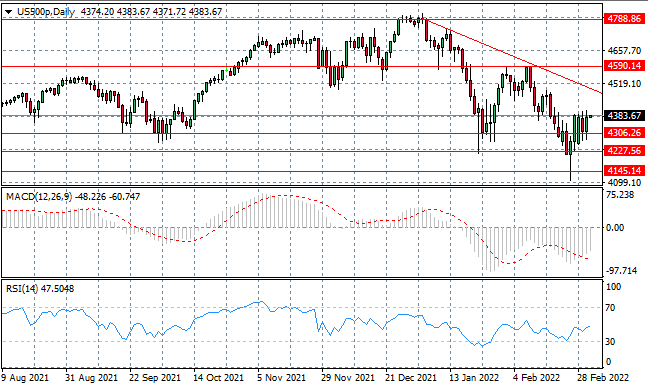
US500
The US500 has found support and is beginning to move away from the 4306 price line. The move has put the descending trendline back in sight which is a resistance zone that has developed over the medium-term signifying a bearish bias.
US500 已找到支撑并开始远离 4306 价格线。此举使下降趋势线重新出现,这是一个在中期形成的阻力区,表明看跌偏见。
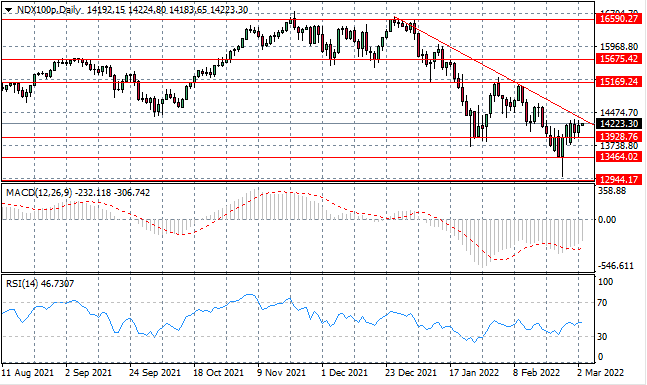
NDX100
The NDX100 is close to testing a key resistance area that has contained previous rallies since late December 2021. Currently, bullish conviction is moderate and may be insufficient to drive a break. Momentum indicators have upward trajectories yet remain in bearish territory.
NDX100 接近测试自 2021 年 12 月下旬以来包含先前反弹的关键阻力区域。目前,看涨信念是温和的,可能不足以推动突破。动量指标具有上行轨迹,但仍处于看跌区域。
In the event of any discrepancies between the Chinese version and English version of the Daily Insights, the latter shall prevail.
以上文章中英文版本若有任何歧义,概以英文版本为准。
This article is to be used only as a reference, not as a basis for trading.
策略仅供参考 不做交易依据
Copyright © 2024 UK UNITED PUHUI TECHNOLOGY CO., LTD,企业编号:11097854
