
 交易书籍,敬请期待
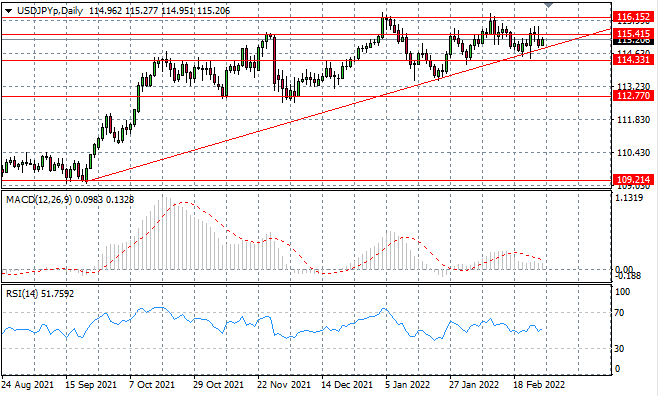
USD/JPY
USDJPY price action has encountered the ascending trendline once again, where in earlier trading, as expected, a bullish rebound appears to be underway. Price action has been contained at the 115.41 resistance line despite some major moves in recent trading, therefore bullish conviction will need to be strong to drive the break.
USDJPY价格走势再次遇到上升趋势线,在早盘交易中,正如预期的那样,看涨反弹似乎正在进行中。尽管近期交易中出现一些重大走势,但价格走势仍被控制在 115.41 阻力线,因此需要强烈的看涨信念才能推动突破。
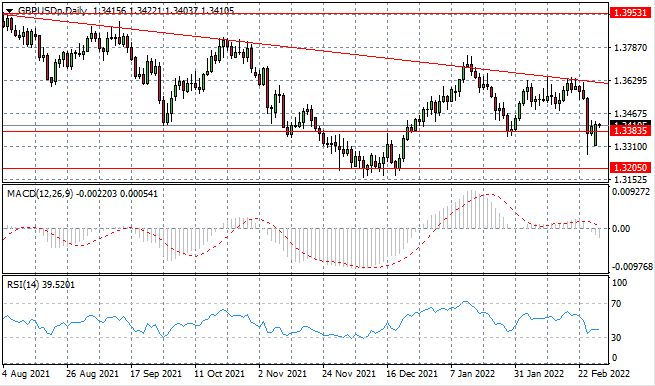
GBP/USD
The GBPUSD pair has broken the 1.338 price line, as a rally attempt will now be made and the descending trendline moves back into sight. Conviction behind the move will be tested in today's session. Momentum indicators remain in bearish territory with MACD extending below the zero line.
GBPUSD已突破 1.338 价格线,由于现在将进行反弹尝试,下降趋势线重新回到视线。此举背后的信念将在今天的会议上受到考验。动量指标仍处于看跌区域,平滑异同移动平均线指标(MACD)延伸至零线下方。
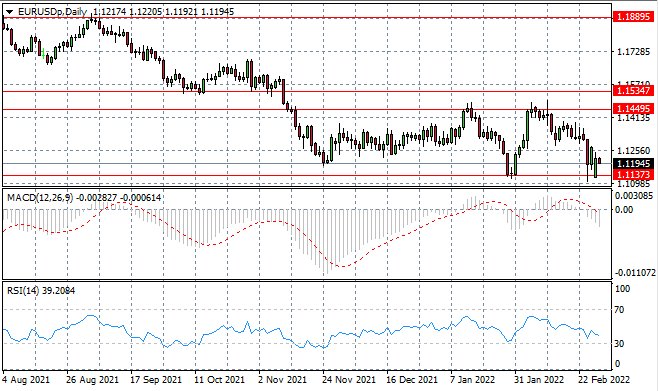
EURUSD
The EURUSD pair has rebounded from a recent low at the 1.113 support line. Bullish conviction appears to have given way to sellers at the start of the Asian session, therefore any rally attempt will be short-lived. Momentum indicators are bearish with downward trajectories.
EURUSD已从近期低点 1.113 支撑线反弹。 在亚洲时段开始时,看涨信念似乎已经让位于空头,因此任何反弹尝试都将是短暂的。动量指标看跌,下行轨迹。
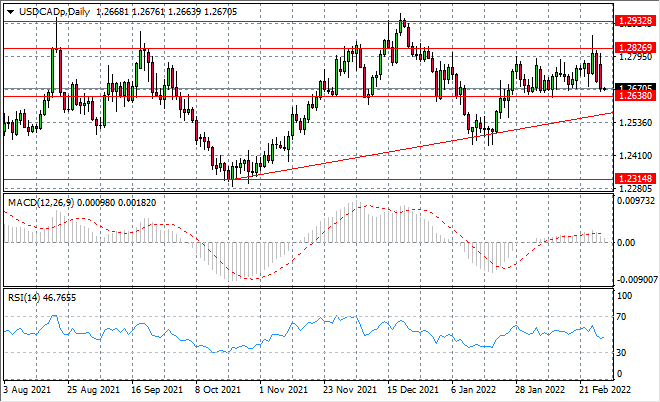
USDCAD
The USDCAD pair is making its way back to the 1.263 support line as huge selling activity has taken place in the last couple of days of trading. The lower bound of the range has held despite repeated attempts to break this consolidation range. Momentum indicators are bearish with MACD testing the zero line.
由于在交易的最后几天发生巨大的抛售活动,USDCAD正回到 1.263 支撑线。尽管多次测试打破该盘整区间,但该区间的下限仍保持不变。动量指标看跌,平滑异同移动平均线指标(MACD)测试零线。
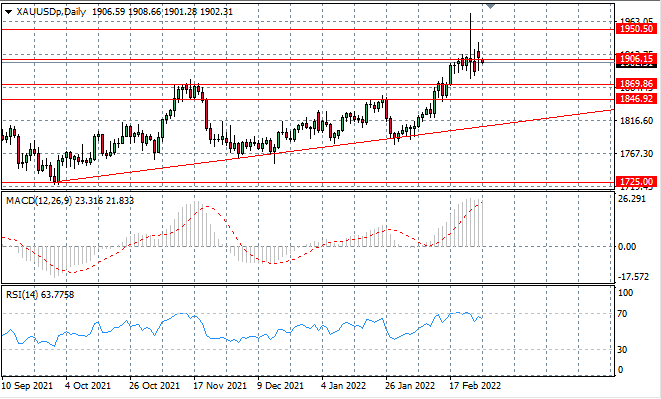
XAUUSD
XAUUSD has begun to fall back as there appears little appetite from buyers and risk sentiment becomes more subdued. A break below the 1906 support line is significant as it represents previous resistance zone. Momentum indicators have flattened in the overbought zone and reversal may be on the cards.
XAUUSD 已开始回落,因为买方的兴趣似乎不大并且风险情绪变得更加低迷。跌破 1906 支撑线意义重大,因为它代表之前的阻力区。动量指标在超买区域趋于平缓,可能会出现反转。
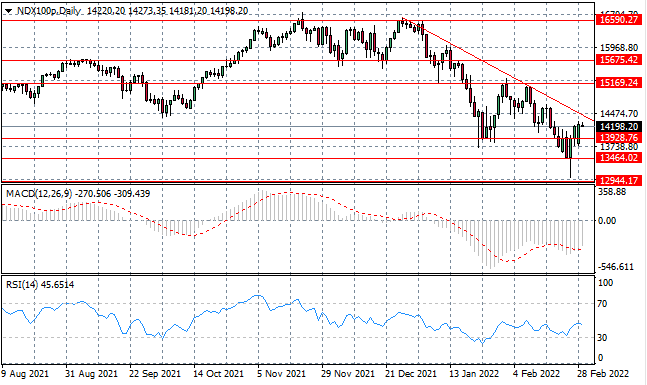
NDX100
The NDX100 has made a recovery with buyers driving a break of the 13,928 resistance line. Price action is fast approaching the descending trendline, where on several previous occasions, price action has rejected the resistance area. Momentum indicators have upward trajectories.
NDX100 已经反弹,买方推动突破 13,928 阻力线。价格走势正在快速接近下降趋势线,在之前的几次情况下,价格走势已经拒绝阻力区域。动量指标具有向上的轨迹。
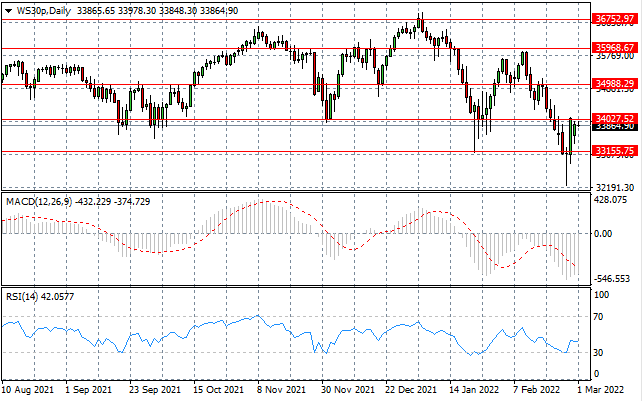
WS30
The WS30 will make another bid at the 34,027 resistance line after being pushed back in a previous attempt. The resistance line represents a previous key support level and an obstacle for sellers. In the longer-term, a bearish bias persists. Momentum indicators are undergoing reversals.
WS30 在之前的尝试中被推回后,将在 34,027 阻力线再次出价。阻力线代表先前的关键支撑位和卖方的障碍。 从长期来看,看跌偏见依然存在。动量指标正在逆转。
In the event of any discrepancies between the Chinese version and English version of the Daily Insights, the latter shall prevail.
以上文章中英文版本若有任何歧义,概以英文版本为准。
This article is to be used only as a reference, not as a basis for trading.
策略仅供参考 不做交易依据
Copyright © FX110 LLP旗下品牌,Trustana LLP为英国工商注册企业,企业编号:OC428353
