
June 5, 2023-MHM European Perspective

Market Overview
The dollar index edged up in early Asian trading on June 5, Beijing time, and is currently trading near 104.09. The US dollar index rose on Friday after data showed non-farm payrolls surged in May, while traders weighed the pros and pros of the Fed possibly skipping one rate hike in June. The report showed non-farm payrolls added 339,000 in May, well above economists' average forecast of 190,000 and following a 253,000 increase in April. Despite the strong hiring, the U.S. unemployment rate rose to 3.7% in May from a 53-year low of 3.4% hit in April.
Oil prices opened nearly 2% higher, trading near $73.28 a barrel, buoyed by the weekend's extension of OPEC+ production cuts to 2024, Saudi Arabia's commitment to deep production cuts in July, and the avoidance of a U.S. debt default as Biden signed a debt ceiling bill.
The day focuses on the revised US April durable goods orders m/m, US April factory orders m/m, US May ISM non-manufacturing PMI.
MHMarkets strategy is only for reference and not for investment advice. Please carefully read the statement at the end of the text. The following strategy will be updated at 15:00 on June 5, Beijing time.
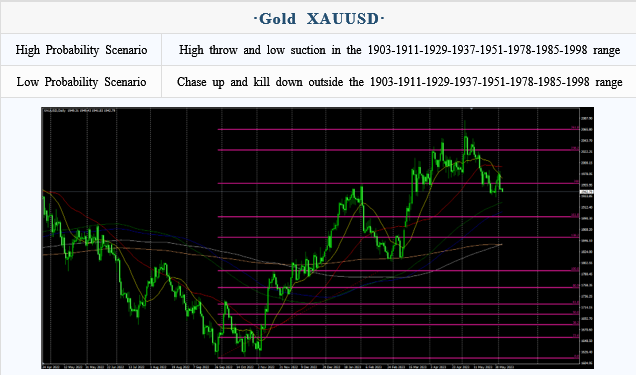
Intraday Oscillation Range: 1903-1911-1929-1937-1951-1978-1985-1998
Overall Oscillation Range: 1730-1756-1780-1801-1817-1833-1856-1873-1889-1903-1911-1929-1937-1951-1978-1985-1998-2007-2016-2033-2046-2057-2066-2077-2089-2097-2100
In the subsequent period of spot gold, 1903-1911-1929-1937-1951-1978-1985-1998 can be operated as the bull and bear range; High throw low suction in the range, chase up and kill down outside the range!
Note: The above strategy was updated at 15:00 on June 5. This policy is a daytime policy. Please pay attention to the policy release time.
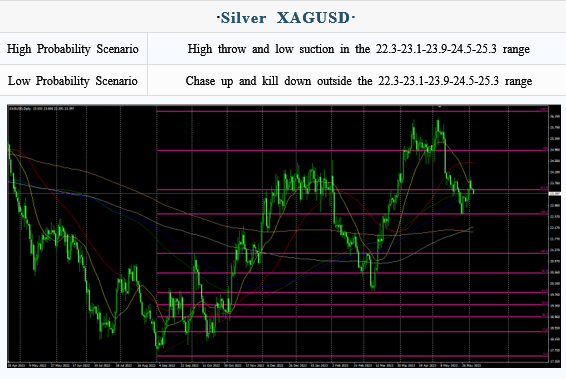
Intraday Oscillation Range: 22.3-23.1-23.9-24.5-25.3
Overall Oscillation Range: 19.7-20.1-20.6-21.5-22.3-23.1-23.9-24.5-25.3-26.1-26.6-27.3
In the subsequent period of spot silver, 22.3-23.1-23.9-24.5-25.3 can be operated as the bull and bear range. High throw and low suction in the range, chase up and kill down outside the range!
Note: The above strategy was updated at 15:00 on June 5. This policy is a daytime policy. Please pay attention to the policy release time.
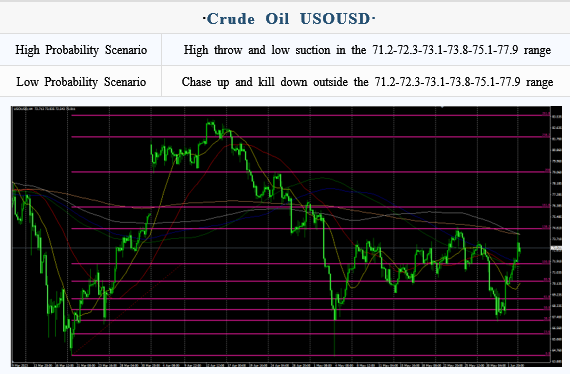
Intraday Oscillation Range: 71.2-72.3-73.1-73.8-75.1-77.9
Overall Oscillation Range: 62.1-63.7-64.5-65.8-66.9-67.3-68.9-70.1-71.2-72.3-73.1-73.8-75.1-77.9-78.5-79.9-80.7-82.3-83.5-85.3-87.3-89.1
In the subsequent period of Crude Oil, 71.2-72.3-73.1-73.8-75.1-77.9 can be operated as the bull and bear range. High throw and low suction in the range, chase up and kill down outside the range!
Note: The above strategy was updated at 15:00 on June 5. This policy is a daytime policy. Please pay attention to the policy release time.
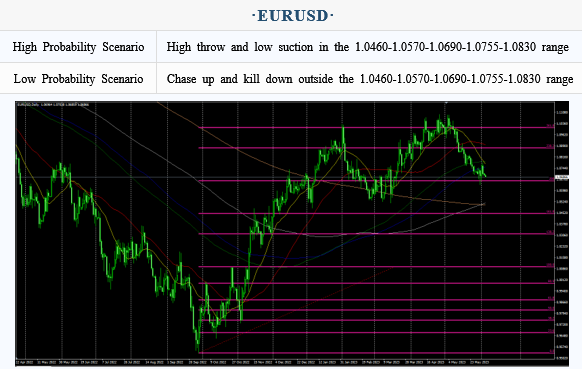
Intraday Oscillation Range: 1.0460-1.0570-1.0690-1.0755-1.0830
Overall Oscillation Range: 1.0290-1.0360-1.0460-1.0570-1.0690-1.0755-1.0830-1.0950-1.1157-1.1220-1.1303
In the subsequent period of EURUSD, 1.0460-1.0570-1.0690-1.0755-1.0830 can be operated as the bull and bear range. High throw and low suction in the range, chase up and kill down outside the range!
Note: The above strategy was updated at 15:00 on June 5. This policy is a daytime policy. Please pay attention to the policy release time.
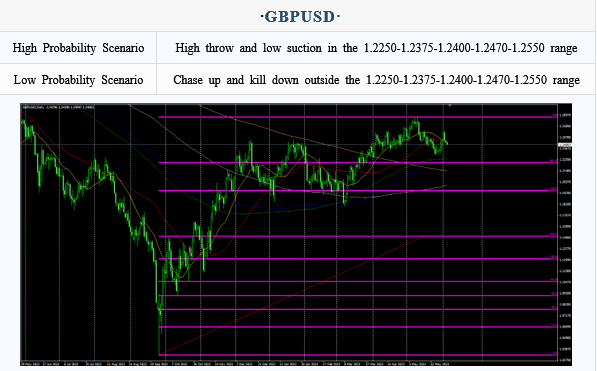
Intraday Oscillation Range: 1.2250-1.2375-1.2400-1.2470-1.2550
Overall Oscillation Range: 1.1610-1.1830-1.1920-1.2030-1.2135-1.2250-1.2375-1.2400-1.2470-1.2550-1.27000
In the subsequent period of GBPUSD, 1.2250-1.2375-1.2400-1.2470-1.2550 can be operated as the bull and bear range. High throw and low suction in the range, chase up and kill down outside the range!
Note: The above strategy was updated at 15:00 on June 5. This policy is a daytime policy. Please pay attention to the policy release time.