
May 26, 2023-MHM European Perspective

Market Overview
Spot gold bottomed out during the Asian session on Friday (May 26) and is currently trading around $1,949.16 per ounce. On the one hand, the delay in the debt ceiling negotiations to reach an agreement, market concerns have picked up, giving gold prices the opportunity to rally. In addition, before the gold price held the 100-day average, some short orders profit taking to leave the field, also to provide support to gold prices. However, overnight U.S. economic data better than market expectations, the market on the Fed's June interest rate hike is expected to further heat up, U.S. bond yields rose sharply to nearly two and a half months high, which is expected to limit the rebound space of gold prices.
This trading day will usher the monthly rate of U.S. durable goods orders in April, the annual rate of U.S. PCE price index in April, the monthly rate of U.S. personal spending in April and other data. Market influence is large, investors need to be concerned. The data on durable goods orders is expected to be slightly more favorable to gold prices, but the PCE and personal spending data is expected to be more favorable to gold prices.
U.S. crude oil has rebounded slightly and is currently trading near $72.08 per barrel. The pullback in the dollar has provided some rebound momentum to oil prices. Oil prices plunged more than 3% overnight as the Russian deputy prime minister downplayed the prospect of further production cuts by OPEC+ at next week's meeting on the one hand and market expectations for a June Fed rate hike on the other, with the dollar index hitting a new high of more than two months.
Markets continue to focus on the U.S. debt ceiling negotiations, with President Biden and Republican House Speaker McCarthy appearing to be close to an agreement to cut spending and raise the debt ceiling, but there are some concerns in the market and investors will need to watch for further related news.
In addition, watch for changes in U.S. crude oil drilling data this trading day.
MHMarkets strategy is only for reference and not for investment advice. Please carefully read the statement at the end of the text. The following strategy will be updated at 15:00 on May 26, Beijing time.
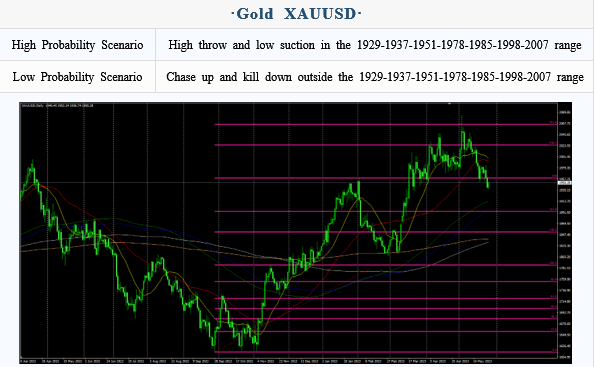
Intraday Oscillation Range: 1929-1937-1951-1978-1985-1998-2007
Overall Oscillation Range: 1730-1756-1780-1801-1817-1833-1856-1873-1889-1903-1911-1929-1937-1951-1978-1985-1998-2007-2016-2033-2046-2057-2066-2077-2089-2097-2100
In the subsequent period of spot gold, 1929-1937-1951-1978-1985-1998-2007 can be operated as the bull and bear range; High throw low suction in the range, chase up and kill down outside the range!
Note: The above strategy was updated at 15:00 on May 26. This policy is a daytime policy. Please pay attention to the policy release time.
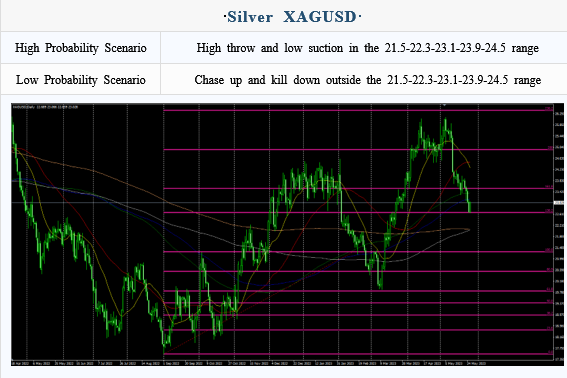
Intraday Oscillation Range: 21.5-22.3-23.1-23.9-24.5
Overall Oscillation Range: 19.7-20.1-20.6-21.5-22.3-23.1-23.9-24.5-25.3-26.1-26.6-27.3
In the subsequent period of spot silver, 21.5-22.3-23.1-23.9-24.5 can be operated as the bull and bear range. High throw and low suction in the range, chase up and kill down outside the range!
Note: The above strategy was updated at 15:00 on May 26. This policy is a daytime policy. Please pay attention to the policy release time.
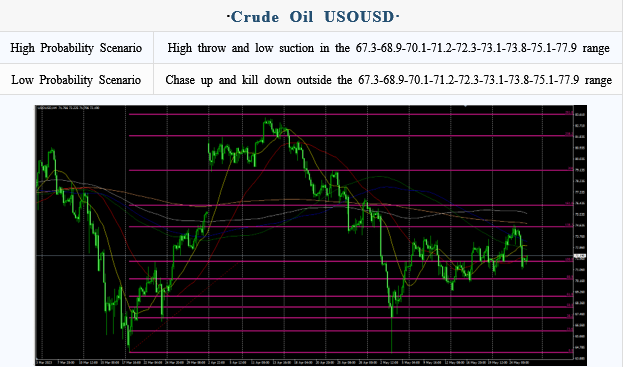
Intraday Oscillation Range: 67.3-68.9-70.1-71.2-72.3-73.1-73.8-75.1-77.9
Overall Oscillation Range: 62.1-63.7-64.5-65.8-66.9-67.3-68.9-70.1-71.2-72.3-73.1-73.8-75.1-77.9-78.5-79.9-80.7-82.3-83.5-85.3-87.3-89.1
In the subsequent period of Crude Oil, 67.3-68.9-70.1-71.2-72.3-73.1-73.8-75.1-77.9 can be operated as the bull and bear range. High throw and low suction in the range, chase up and kill down outside the range!
Note: The above strategy was updated at 15:00 on May 26. This policy is a daytime policy. Please pay attention to the policy release time.
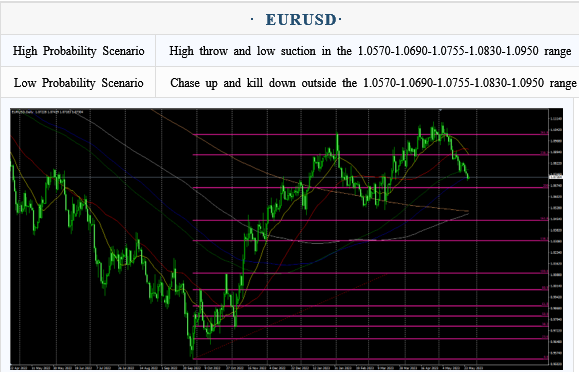
Intraday Oscillation Range: 1.0570-1.0690-1.0755-1.0830-1.0950
Overall Oscillation Range: 1.0290-1.0360-1.0460-1.0570-1.0690-1.0755-1.0830-1.0950-1.1157-1.1220-1.1303
In the subsequent period of EURUSD, 1.0570-1.0690-1.0755-1.0830-1.0950 can be operated as the bull and bear range. High throw and low suction in the range, chase up and kill down outside the range!
Note: The above strategy was updated at 15:00 on May 26. This policy is a daytime policy. Please pay attention to the policy release time.
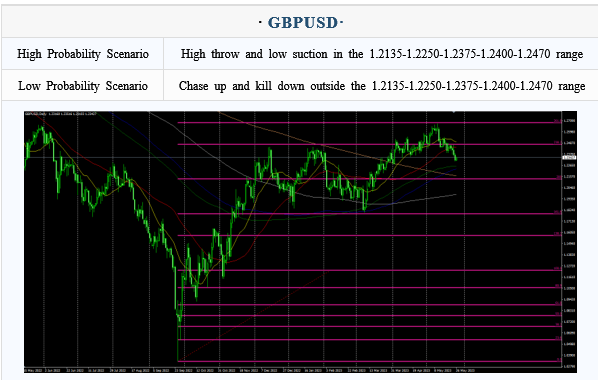
Intraday Oscillation Range: 1.2135-1.2250-1.2375-1.2400-1.2470
Overall Oscillation Range: 1.1610-1.1830-1.1920-1.2030-1.2135-1.2250-1.2375-1.2400-1.2470-1.2550-1.27000
In the subsequent period of GBPUSD, 1.2135-1.2250-1.2375-1.2400-1.2470 can be operated as the bull and bear range. High throw and low suction in the range, chase up and kill down outside the range!
Note: The above strategy was updated at 15:00 on May 26. This policy is a daytime policy. Please pay attention to the policy release time.